A Rising Share Price Has Us Looking Closely At MBH Corporation PLC's (FRA:M8H) P/E Ratio

MBH (FRA:M8H) shares have had a really impressive month, gaining 38%, after some slippage. But shareholders may not all be feeling jubilant, since the share price is still down 42% in the last year.
Assuming no other changes, a sharply higher share price makes a stock less attractive to potential buyers. In the long term, share prices tend to follow earnings per share, but in the short term prices bounce around in response to short term factors (which are not always obvious). The implication here is that deep value investors might steer clear when expectations of a company are too high. One way to gauge market expectations of a stock is to look at its Price to Earnings Ratio (PE Ratio). A high P/E ratio means that investors have a high expectation about future growth, while a low P/E ratio means they have low expectations about future growth.
View our latest analysis for MBH
Does MBH Have A Relatively High Or Low P/E For Its Industry?
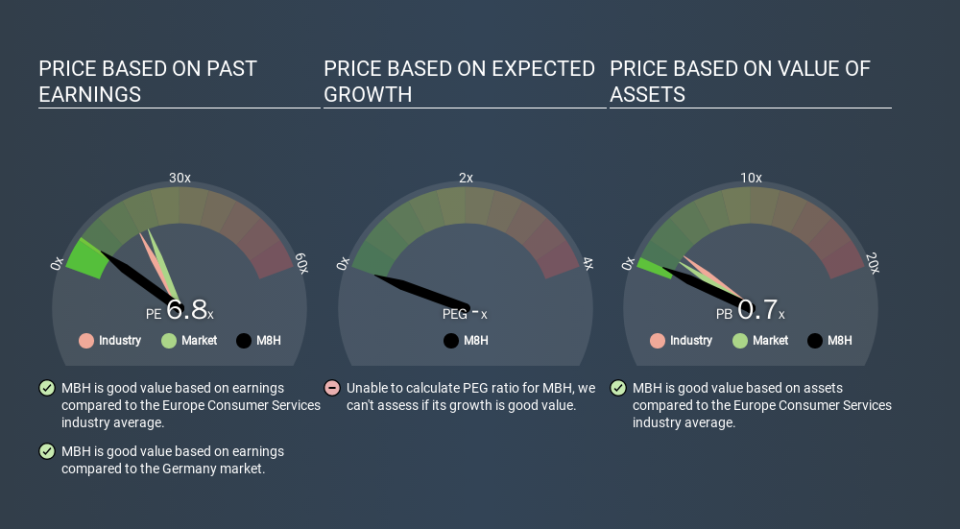
MBH's P/E of 6.80 indicates relatively low sentiment towards the stock. The image below shows that MBH has a lower P/E than the average (18.0) P/E for companies in the consumer services industry.
Its relatively low P/E ratio indicates that MBH shareholders think it will struggle to do as well as other companies in its industry classification. Since the market seems unimpressed with MBH, it's quite possible it could surprise on the upside. You should delve deeper. I like to check if company insiders have been buying or selling.
How Growth Rates Impact P/E Ratios
Earnings growth rates have a big influence on P/E ratios. Earnings growth means that in the future the 'E' will be higher. And in that case, the P/E ratio itself will drop rather quickly. A lower P/E should indicate the stock is cheap relative to others -- and that may attract buyers.
MBH's earnings made like a rocket, taking off 62% last year.
Remember: P/E Ratios Don't Consider The Balance Sheet
It's important to note that the P/E ratio considers the market capitalization, not the enterprise value. In other words, it does not consider any debt or cash that the company may have on the balance sheet. Hypothetically, a company could reduce its future P/E ratio by spending its cash (or taking on debt) to achieve higher earnings.
Such expenditure might be good or bad, in the long term, but the point here is that the balance sheet is not reflected by this ratio.
Is Debt Impacting MBH's P/E?
With net cash of UK£3.3m, MBH has a very strong balance sheet, which may be important for its business. Having said that, at 14% of its market capitalization the cash hoard would contribute towards a higher P/E ratio.
The Verdict On MBH's P/E Ratio
MBH trades on a P/E ratio of 6.8, which is below the DE market average of 20.2. Not only should the net cash position reduce risk, but the recent growth has been impressive. The below average P/E ratio suggests that market participants don't believe the strong growth will continue. What is very clear is that the market has become less pessimistic about MBH over the last month, with the P/E ratio rising from 4.9 back then to 6.8 today. If you like to buy stocks that could be turnaround opportunities, then this one might be a candidate; but if you're more sensitive to price, then you may feel the opportunity has passed.
Investors should be looking to buy stocks that the market is wrong about. If it is underestimating a company, investors can make money by buying and holding the shares until the market corrects itself. So this free report on the analyst consensus forecasts could help you make a master move on this stock.
But note: MBH may not be the best stock to buy. So take a peek at this free list of interesting companies with strong recent earnings growth (and a P/E ratio below 20).
If you spot an error that warrants correction, please contact the editor at editorial-team@simplywallst.com. This article by Simply Wall St is general in nature. It does not constitute a recommendation to buy or sell any stock, and does not take account of your objectives, or your financial situation. Simply Wall St has no position in the stocks mentioned.
We aim to bring you long-term focused research analysis driven by fundamental data. Note that our analysis may not factor in the latest price-sensitive company announcements or qualitative material. Thank you for reading.
