A Rising Share Price Has Us Looking Closely At Bright Solar Limited's (NSE:BRIGHT) P/E Ratio

Bright Solar (NSE:BRIGHT) shareholders are no doubt pleased to see that the share price has bounced 31% in the last month alone, although it is still down 42% over the last quarter. But that will do little to salve the savage burn caused by the 71% share price decline, over the last year.
Assuming no other changes, a sharply higher share price makes a stock less attractive to potential buyers. In the long term, share prices tend to follow earnings per share, but in the short term prices bounce around in response to short term factors (which are not always obvious). So some would prefer to hold off buying when there is a lot of optimism towards a stock. Perhaps the simplest way to get a read on investors' expectations of a business is to look at its Price to Earnings Ratio (PE Ratio). A high P/E implies that investors have high expectations of what a company can achieve compared to a company with a low P/E ratio.
Check out our latest analysis for Bright Solar
Does Bright Solar Have A Relatively High Or Low P/E For Its Industry?
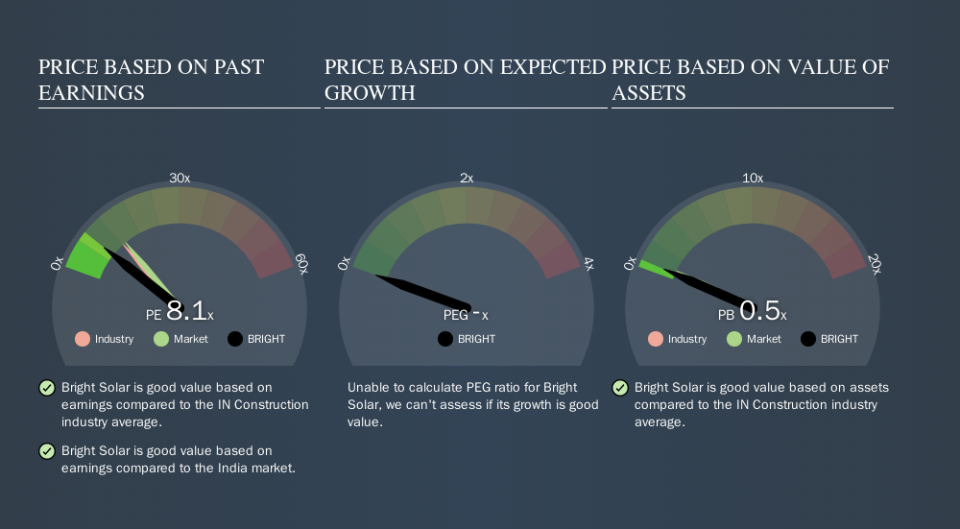
Bright Solar's P/E of 8.07 indicates relatively low sentiment towards the stock. The image below shows that Bright Solar has a lower P/E than the average (12.2) P/E for companies in the construction industry.
Bright Solar's P/E tells us that market participants think it will not fare as well as its peers in the same industry. While current expectations are low, the stock could be undervalued if the situation is better than the market assumes. You should delve deeper. I like to check if company insiders have been buying or selling.
How Growth Rates Impact P/E Ratios
Probably the most important factor in determining what P/E a company trades on is the earnings growth. That's because companies that grow earnings per share quickly will rapidly increase the 'E' in the equation. Therefore, even if you pay a high multiple of earnings now, that multiple will become lower in the future. A lower P/E should indicate the stock is cheap relative to others -- and that may attract buyers.
Bright Solar's earnings per share fell by 70% in the last twelve months. But it has grown its earnings per share by 25% per year over the last five years.
A Limitation: P/E Ratios Ignore Debt and Cash In The Bank
Don't forget that the P/E ratio considers market capitalization. That means it doesn't take debt or cash into account. Hypothetically, a company could reduce its future P/E ratio by spending its cash (or taking on debt) to achieve higher earnings.
Such spending might be good or bad, overall, but the key point here is that you need to look at debt to understand the P/E ratio in context.
Bright Solar's Balance Sheet
With net cash of ₹23m, Bright Solar has a very strong balance sheet, which may be important for its business. Having said that, at 12% of its market capitalization the cash hoard would contribute towards a higher P/E ratio.
The Bottom Line On Bright Solar's P/E Ratio
Bright Solar has a P/E of 8.1. That's below the average in the IN market, which is 13.1. The recent drop in earnings per share would make investors cautious, but the net cash position means the company has time to improve: if so, the low P/E could be an opportunity. What we know for sure is that investors are becoming less uncomfortable about Bright Solar's prospects, since they have pushed its P/E ratio from 6.2 to 8.1 over the last month. For those who like to invest in turnarounds, that might mean it's time to put the stock on a watchlist, or research it. But others might consider the opportunity to have passed.
When the market is wrong about a stock, it gives savvy investors an opportunity. If the reality for a company is not as bad as the P/E ratio indicates, then the share price should increase as the market realizes this. We don't have analyst forecasts, but you could get a better understanding of its growth by checking out this more detailed historical graph of earnings, revenue and cash flow.
Of course, you might find a fantastic investment by looking at a few good candidates. So take a peek at this free list of companies with modest (or no) debt, trading on a P/E below 20.
We aim to bring you long-term focused research analysis driven by fundamental data. Note that our analysis may not factor in the latest price-sensitive company announcements or qualitative material.
If you spot an error that warrants correction, please contact the editor at editorial-team@simplywallst.com. This article by Simply Wall St is general in nature. It does not constitute a recommendation to buy or sell any stock, and does not take account of your objectives, or your financial situation. Simply Wall St has no position in the stocks mentioned. Thank you for reading.
