Is RTX A/S's (CPH:RTX) 22% ROE Better Than Average?

Many investors are still learning about the various metrics that can be useful when analysing a stock. This article is for those who would like to learn about Return On Equity (ROE). By way of learning-by-doing, we'll look at ROE to gain a better understanding of RTX A/S (CPH:RTX).
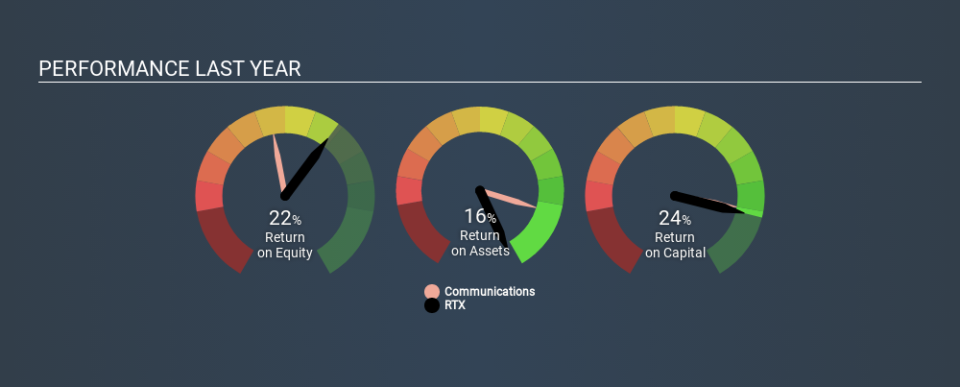
RTX has a ROE of 22%, based on the last twelve months. That means that for every DKK1 worth of shareholders' equity, it generated DKK0.22 in profit.
View our latest analysis for RTX
How Do I Calculate ROE?
The formula for return on equity is:
Return on Equity = Net Profit (from continuing operations) ÷ Shareholders' Equity
Or for RTX:
22% = ø75m ÷ ø345m (Based on the trailing twelve months to December 2019.)
Most readers would understand what net profit is, but it’s worth explaining the concept of shareholders’ equity. It is all earnings retained by the company, plus any capital paid in by shareholders. You can calculate shareholders' equity by subtracting the company's total liabilities from its total assets.
What Does ROE Mean?
ROE looks at the amount a company earns relative to the money it has kept within the business. The 'return' is the profit over the last twelve months. That means that the higher the ROE, the more profitable the company is. So, all else equal, investors should like a high ROE. That means ROE can be used to compare two businesses.
Does RTX Have A Good Return On Equity?
One simple way to determine if a company has a good return on equity is to compare it to the average for its industry. However, this method is only useful as a rough check, because companies do differ quite a bit within the same industry classification. As is clear from the image below, RTX has a better ROE than the average (14%) in the Communications industry.
That's what I like to see. In my book, a high ROE almost always warrants a closer look. One data point to check is if insiders have bought shares recently.
How Does Debt Impact Return On Equity?
Most companies need money -- from somewhere -- to grow their profits. That cash can come from issuing shares, retained earnings, or debt. In the first and second cases, the ROE will reflect this use of cash for investment in the business. In the latter case, the debt required for growth will boost returns, but will not impact the shareholders' equity. That will make the ROE look better than if no debt was used.
RTX's Debt And Its 22% ROE
One positive for shareholders is that RTX does not have any net debt! Its high ROE indicates the business is high quality, but the fact that this was achieved without leverage is veritably impressive. After all, with cash on the balance sheet, a company has a lot more optionality in good times and bad.
In Summary
Return on equity is useful for comparing the quality of different businesses. A company that can achieve a high return on equity without debt could be considered a high quality business. If two companies have around the same level of debt to equity, and one has a higher ROE, I'd generally prefer the one with higher ROE.
But when a business is high quality, the market often bids it up to a price that reflects this. The rate at which profits are likely to grow, relative to the expectations of profit growth reflected in the current price, must be considered, too. Check the past profit growth by RTX by looking at this visualization of past earnings, revenue and cash flow.
If you would prefer check out another company -- one with potentially superior financials -- then do not miss thisfree list of interesting companies, that have HIGH return on equity and low debt.
If you spot an error that warrants correction, please contact the editor at editorial-team@simplywallst.com. This article by Simply Wall St is general in nature. It does not constitute a recommendation to buy or sell any stock, and does not take account of your objectives, or your financial situation. Simply Wall St has no position in the stocks mentioned.
We aim to bring you long-term focused research analysis driven by fundamental data. Note that our analysis may not factor in the latest price-sensitive company announcements or qualitative material. Thank you for reading.
