What Can We Make Of Rubis’s (EPA:RUI) High Return On Capital?

Today we are going to look at Rubis (EPA:RUI) to see whether it might be an attractive investment prospect. To be precise, we'll consider its Return On Capital Employed (ROCE), as that will inform our view of the quality of the business.
First up, we'll look at what ROCE is and how we calculate it. Next, we'll compare it to others in its industry. Last but not least, we'll look at what impact its current liabilities have on its ROCE.
What is Return On Capital Employed (ROCE)?
ROCE measures the 'return' (pre-tax profit) a company generates from capital employed in its business. Generally speaking a higher ROCE is better. Overall, it is a valuable metric that has its flaws. Renowned investment researcher Michael Mauboussin has suggested that a high ROCE can indicate that 'one dollar invested in the company generates value of more than one dollar'.
How Do You Calculate Return On Capital Employed?
The formula for calculating the return on capital employed is:
Return on Capital Employed = Earnings Before Interest and Tax (EBIT) ÷ (Total Assets - Current Liabilities)
Or for Rubis:
0.10 = €391m ÷ (€4.7b - €903m) (Based on the trailing twelve months to December 2018.)
Therefore, Rubis has an ROCE of 10%.
See our latest analysis for Rubis
Does Rubis Have A Good ROCE?
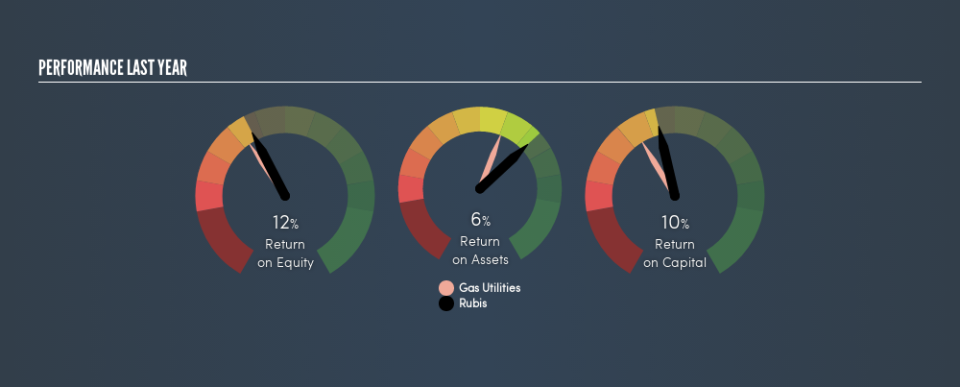
ROCE can be useful when making comparisons, such as between similar companies. Using our data, we find that Rubis's ROCE is meaningfully better than the 7.9% average in the Gas Utilities industry. We would consider this a positive, as it suggests it is using capital more effectively than other similar companies. Separate from Rubis's performance relative to its industry, its ROCE in absolute terms looks satisfactory, and it may be worth researching in more depth.
We can see that , Rubis currently has an ROCE of 10% compared to its ROCE 3 years ago, which was 8.2%. This makes us wonder if the company is improving. The image below shows how Rubis's ROCE compares to its industry, and you can click it to see more detail on its past growth.
Remember that this metric is backwards looking - it shows what has happened in the past, and does not accurately predict the future. ROCE can be misleading for companies in cyclical industries, with returns looking impressive during the boom times, but very weak during the busts. This is because ROCE only looks at one year, instead of considering returns across a whole cycle. Since the future is so important for investors, you should check out our free report on analyst forecasts for Rubis.
What Are Current Liabilities, And How Do They Affect Rubis's ROCE?
Liabilities, such as supplier bills and bank overdrafts, are referred to as current liabilities if they need to be paid within 12 months. Due to the way ROCE is calculated, a high level of current liabilities makes a company look as though it has less capital employed, and thus can (sometimes unfairly) boost the ROCE. To counter this, investors can check if a company has high current liabilities relative to total assets.
Rubis has total liabilities of €903m and total assets of €4.7b. As a result, its current liabilities are equal to approximately 19% of its total assets. Current liabilities are minimal, limiting the impact on ROCE.
The Bottom Line On Rubis's ROCE
This is good to see, and with a sound ROCE, Rubis could be worth a closer look. Rubis shapes up well under this analysis, but it is far from the only business delivering excellent numbers . You might also want to check this free collection of companies delivering excellent earnings growth.
For those who like to find winning investments this free list of growing companies with recent insider purchasing, could be just the ticket.
We aim to bring you long-term focused research analysis driven by fundamental data. Note that our analysis may not factor in the latest price-sensitive company announcements or qualitative material.
If you spot an error that warrants correction, please contact the editor at editorial-team@simplywallst.com. This article by Simply Wall St is general in nature. It does not constitute a recommendation to buy or sell any stock, and does not take account of your objectives, or your financial situation. Simply Wall St has no position in the stocks mentioned. Thank you for reading.

