Do Ruifeng Power Group Company Limited’s (HKG:2025) Returns On Capital Employed Make The Cut?

Today we are going to look at Ruifeng Power Group Company Limited (HKG:2025) to see whether it might be an attractive investment prospect. Specifically, we're going to calculate its Return On Capital Employed (ROCE), in the hopes of getting some insight into the business.
First up, we'll look at what ROCE is and how we calculate it. Next, we'll compare it to others in its industry. Finally, we'll look at how its current liabilities affect its ROCE.
Return On Capital Employed (ROCE): What is it?
ROCE measures the amount of pre-tax profits a company can generate from the capital employed in its business. All else being equal, a better business will have a higher ROCE. Ultimately, it is a useful but imperfect metric. Author Edwin Whiting says to be careful when comparing the ROCE of different businesses, since 'No two businesses are exactly alike.
How Do You Calculate Return On Capital Employed?
The formula for calculating the return on capital employed is:
Return on Capital Employed = Earnings Before Interest and Tax (EBIT) ÷ (Total Assets - Current Liabilities)
Or for Ruifeng Power Group:
0.10 = CN¥99m ÷ (CN¥1.4b - CN¥422m) (Based on the trailing twelve months to June 2019.)
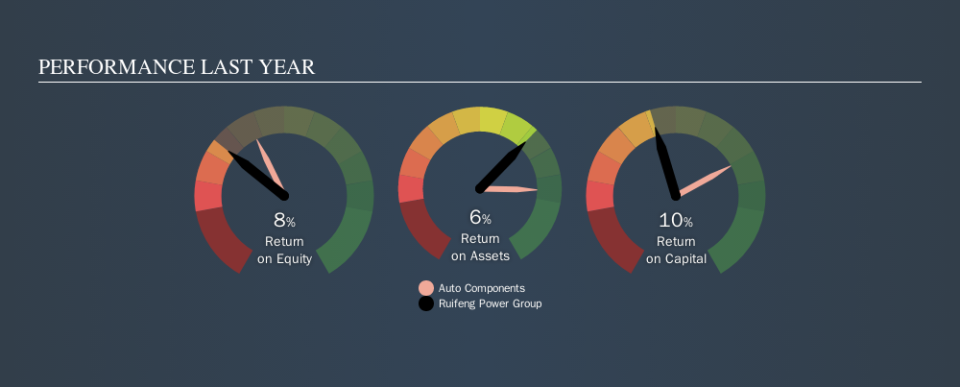
Therefore, Ruifeng Power Group has an ROCE of 10.0%.
View our latest analysis for Ruifeng Power Group
Does Ruifeng Power Group Have A Good ROCE?
ROCE can be useful when making comparisons, such as between similar companies. It appears that Ruifeng Power Group's ROCE is fairly close to the Auto Components industry average of 11%. Separate from how Ruifeng Power Group stacks up against its industry, its ROCE in absolute terms is mediocre; relative to the returns on government bonds. It is possible that there are more rewarding investments out there.
Ruifeng Power Group's current ROCE of 10.0% is lower than its ROCE in the past, which was 19%, 3 years ago. This makes us wonder if the business is facing new challenges. You can see in the image below how Ruifeng Power Group's ROCE compares to its industry. Click to see more on past growth.
When considering this metric, keep in mind that it is backwards looking, and not necessarily predictive. ROCE can be misleading for companies in cyclical industries, with returns looking impressive during the boom times, but very weak during the busts. This is because ROCE only looks at one year, instead of considering returns across a whole cycle. You can check if Ruifeng Power Group has cyclical profits by looking at this free graph of past earnings, revenue and cash flow.
What Are Current Liabilities, And How Do They Affect Ruifeng Power Group's ROCE?
Short term (or current) liabilities, are things like supplier invoices, overdrafts, or tax bills that need to be paid within 12 months. Due to the way the ROCE equation works, having large bills due in the near term can make it look as though a company has less capital employed, and thus a higher ROCE than usual. To check the impact of this, we calculate if a company has high current liabilities relative to its total assets.
Ruifeng Power Group has total assets of CN¥1.4b and current liabilities of CN¥422m. Therefore its current liabilities are equivalent to approximately 30% of its total assets. It is good to see a restrained amount of current liabilities, as this limits the effect on ROCE.
Our Take On Ruifeng Power Group's ROCE
With that in mind, we're not overly impressed with Ruifeng Power Group's ROCE, so it may not be the most appealing prospect. Of course, you might find a fantastic investment by looking at a few good candidates. So take a peek at this free list of companies with modest (or no) debt, trading on a P/E below 20.
I will like Ruifeng Power Group better if I see some big insider buys. While we wait, check out this free list of growing companies with considerable, recent, insider buying.
We aim to bring you long-term focused research analysis driven by fundamental data. Note that our analysis may not factor in the latest price-sensitive company announcements or qualitative material.
If you spot an error that warrants correction, please contact the editor at editorial-team@simplywallst.com. This article by Simply Wall St is general in nature. It does not constitute a recommendation to buy or sell any stock, and does not take account of your objectives, or your financial situation. Simply Wall St has no position in the stocks mentioned. Thank you for reading.
