New satellite mapping with AI can quickly pinpoint hurricane damage across an entire state to spot where people may be trapped
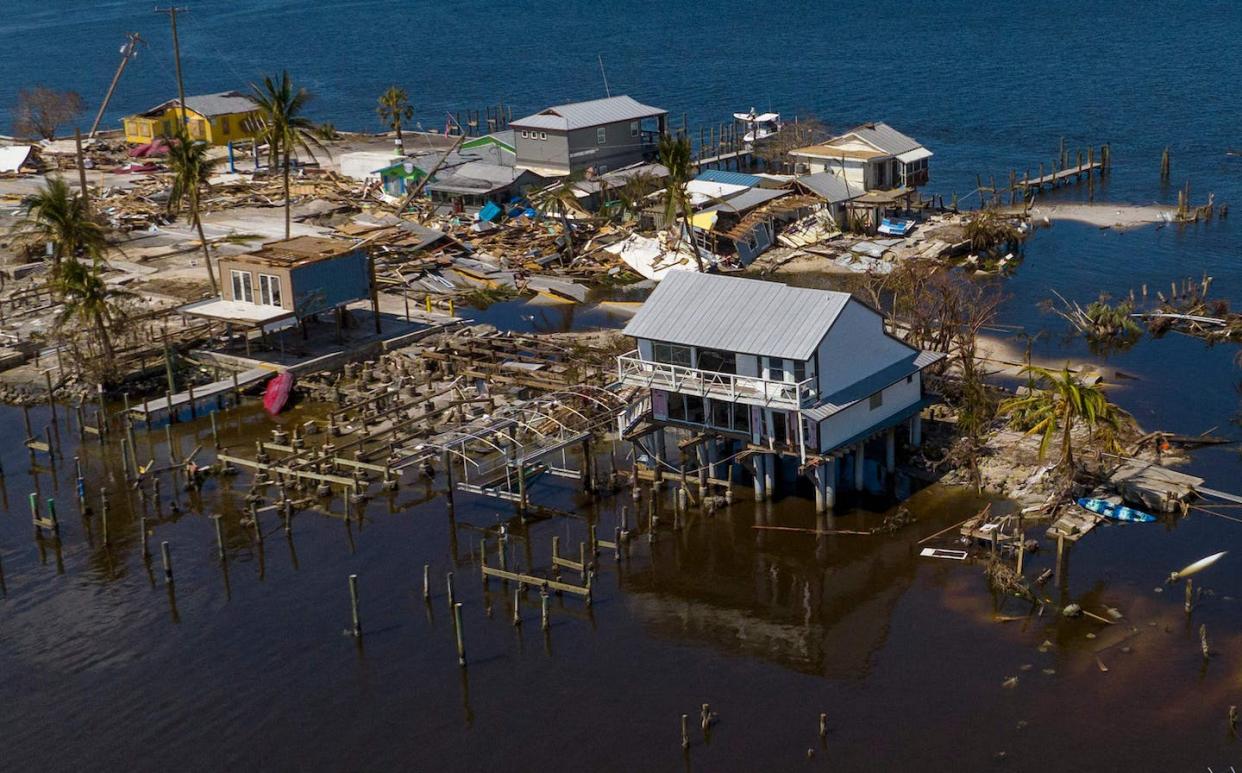
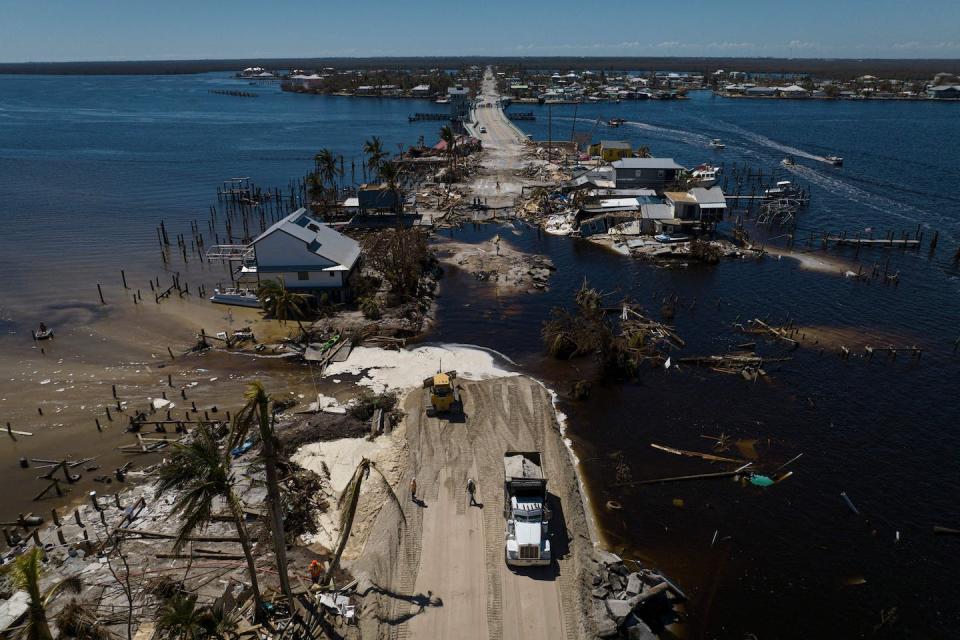
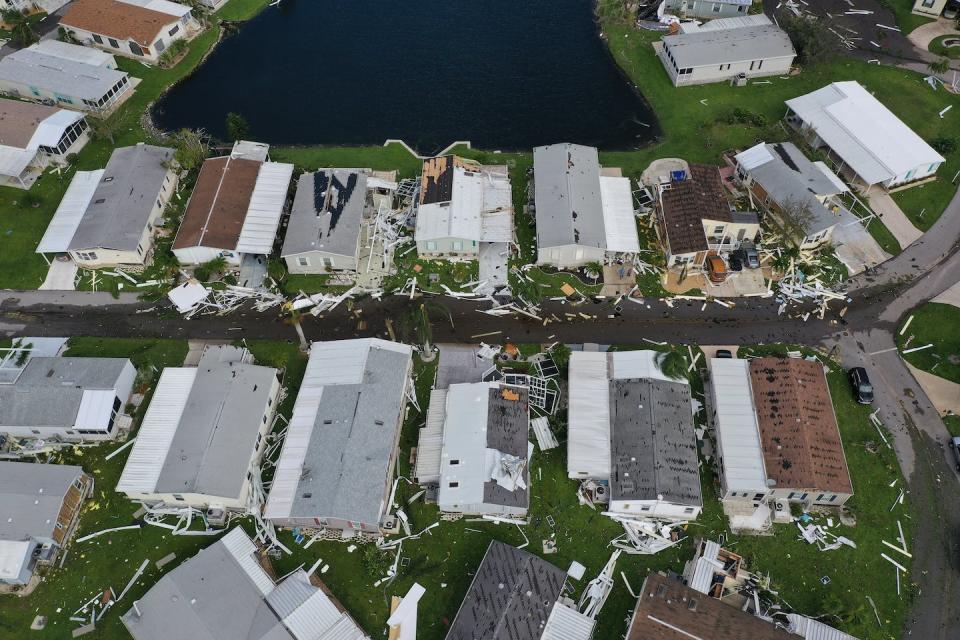
Hurricane Ian left an extraordinarily broad path of destruction across much of South Florida. That was evident in reports from the ground, but it also shows up in satellite data. Using a new method, our team of spatial and environmental analysts was able to quickly provide a rare big picture view of damage across the entire state.
By using satellite images from before the storm and real-time images from four satellite sensors, together with artificial intelligence, we created a disaster monitoring system that can map damage in 30-meter resolution and continuously update the data.
It’s a snapshot of what faster, more targeted disaster monitoring can look like in the future – and something that could eventually be deployed nationwide.
How artificial intellegence spots the damage
Satellites are already used to identify high-risk areas for floods, wildfires, landslides and other disasters, and to pinpoint the damage after these disasters. But most satelite-based disaster management approaches rely on visually assessing the latest images, one neighborhood at a time.
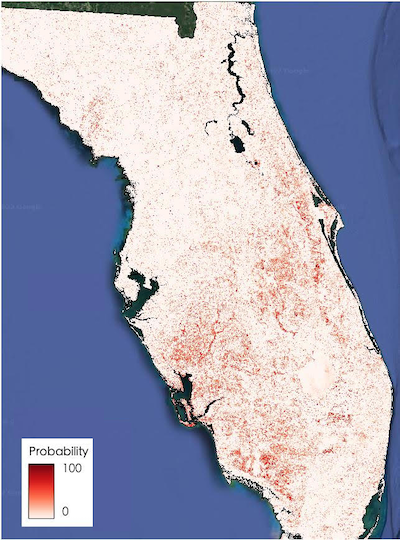
Our technique automatically compares pre-storm images with current satellite images to spot anomalies quickly over large areas. Those anomalies might be sand or water where that sand or water shouldn’t be, or heavily damaged roofs that don’t match their pre-storm appearance. Each area with a significant anomaly is flagged in yellow.
Five days after Ian lashed Florida, the map showed yellow alert polygons all over South Florida. We found that it could spot patches of damage with about 84% accuracy.
A natural disaster like a hurricane or tornado often leaves behind large areas of spectral change at the surface, meaning changes in how light reflects off whatever is there, such as houses, ground or water. Our algorithm compares the reflectance in models based on pre-storm images with reflectance after the storm.
The system spots both changes in physical properties of natural areas, such as changes in wetness or brightness, and the overall intensity of the change. An increase in brightness often is related to exposed sand or bare land due to hurricane damage.
Using a machine-learning model, we can use those images to predict disturbance probabilities, which measures the influences of natural disaster on land surfaces. This approach allows us to automate disaster mapping and provide full coverage of an entire state as soon as the satellite data is released.
The system uses data from four satellites, Landsat 8 and Landsat 9, both operated by NASA and the U.S. Geological Survey, and Sentinel 2A and Sentinel 2B, launched as part of the European Commission’s Copernicus program.
Real-time monitoring, nationwide
Extreme storms with destructive flooding have been documented with increasing frequency over large parts of the globe in recent years.
While disaster response teams can rely on airplane surveillance and drones to pinpoint damage in small areas, it’s much harder to see the big picture in a widespread disaster like hurricanes and other tropical cyclones, and time is of the essence. Our system provides a fast approach using free government-produced images to see the big picture. One current drawback is the timing of those images, which often aren’t released publicly until a few days after the disaster.
We are now working on developing near real-time monitoring of the whole conterminous United States to quickly provide the most up-to-date land information for the next natural disaster.
This article is republished from The Conversation, an independent nonprofit news site dedicated to sharing ideas from academic experts. It was written by: Zhe Zhu, University of Connecticut and Su Ye, University of Connecticut. If you found it interesting, you could subscribe to our weekly newsletter.
Read more:
Zhe Zhu receives funding from the USGS-NASA Landsat Science Team Program for Toward Near Real-time Monitoring and Characterization of Landsat Surface Change for the Conterminous US (140G0119C0008)
Su Ye does not work for, consult, own shares in or receive funding from any company or organization that would benefit from this article, and has disclosed no relevant affiliations beyond their academic appointment.

