Is Self Storage Group ASA’s (OB:SSG) High P/E Ratio A Problem For Investors?

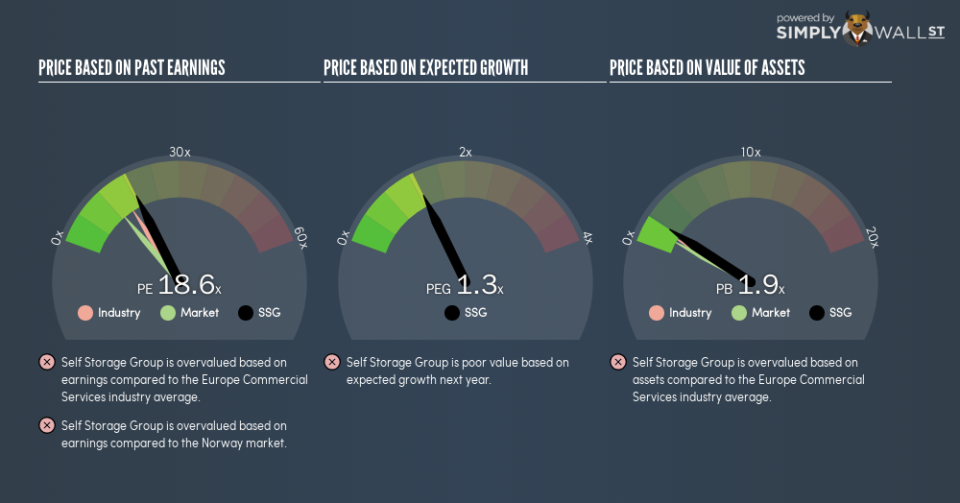
This article is written for those who want to get better at using price to earnings ratios (P/E ratios). We’ll look at Self Storage Group ASA’s (OB:SSG) P/E ratio and reflect on what it tells us about the company’s share price. Based on the last twelve months, Self Storage Group’s P/E ratio is 18.64. In other words, at today’s prices, investors are paying NOK18.64 for every NOK1 in prior year profit.
Check out our latest analysis for Self Storage Group
Want to help shape the future of investing tools and platforms? Take the survey and be part of one of the most advanced studies of stock market investors to date.
How Do I Calculate A Price To Earnings Ratio?
The formula for P/E is:
Price to Earnings Ratio = Price per Share ÷ Earnings per Share (EPS)
Or for Self Storage Group:
P/E of 18.64 = NOK16.5 ÷ NOK0.89 (Based on the year to September 2018.)
Is A High Price-to-Earnings Ratio Good?
A higher P/E ratio means that buyers have to pay a higher price for each NOK1 the company has earned over the last year. All else being equal, it’s better to pay a low price — but as Warren Buffett said, ‘It’s far better to buy a wonderful company at a fair price than a fair company at a wonderful price.’
How Growth Rates Impact P/E Ratios
If earnings fall then in the future the ‘E’ will be lower. That means unless the share price falls, the P/E will increase in a few years. A higher P/E should indicate the stock is expensive relative to others — and that may encourage shareholders to sell.
Self Storage Group saw earnings per share decrease by 23% last year. And it has shrunk its earnings per share by 4.6% per year over the last three years. This growth rate might warrant a low P/E ratio. This growth rate might warrant a low P/E ratio.
How Does Self Storage Group’s P/E Ratio Compare To Its Peers?
We can get an indication of market expectations by looking at the P/E ratio. As you can see below, Self Storage Group has a higher P/E than the average company (16) in the commercial services industry.
Self Storage Group’s P/E tells us that market participants think the company will perform better than its industry peers, going forward. The market is optimistic about the future, but that doesn’t guarantee future growth. So investors should always consider the P/E ratio alongside other factors, such as whether company directors have been buying shares.
Don’t Forget: The P/E Does Not Account For Debt or Bank Deposits
Don’t forget that the P/E ratio considers market capitalization. Thus, the metric does not reflect cash or debt held by the company. Theoretically, a business can improve its earnings (and produce a lower P/E in the future), by taking on debt (or spending its remaining cash).
Such expenditure might be good or bad, in the long term, but the point here is that the balance sheet is not reflected by this ratio.
Self Storage Group’s Balance Sheet
The extra options and safety that comes with Self Storage Group’s øre17m net cash position means that it deserves a higher P/E than it would if it had a lot of net debt.
The Verdict On Self Storage Group’s P/E Ratio
Self Storage Group has a P/E of 18.6. That’s higher than the average in the NO market, which is 12.9. Falling earnings per share is probably keeping traditional value investors away, but the healthy balance sheet means the company retains potential for future growth. If fails to eventuate, the current high P/E could prove to be temporary, as the share price falls.
Investors have an opportunity when market expectations about a stock are wrong. If the reality for a company is better than it expects, you can make money by buying and holding for the long term. So this free visualization of the analyst consensus on future earnings could help you make the right decision about whether to buy, sell, or hold.
You might be able to find a better buy than Self Storage Group. If you want a selection of possible winners, check out this free list of interesting companies that trade on a P/E below 20 (but have proven they can grow earnings).
To help readers see past the short term volatility of the financial market, we aim to bring you a long-term focused research analysis purely driven by fundamental data. Note that our analysis does not factor in the latest price-sensitive company announcements.
The author is an independent contributor and at the time of publication had no position in the stocks mentioned. For errors that warrant correction please contact the editor at editorial-team@simplywallst.com.
