Shareholders Should Look Hard At Universal Stainless & Alloy Products, Inc.’s (NASDAQ:USAP) 2.3%Return On Capital

Today we'll evaluate Universal Stainless & Alloy Products, Inc. (NASDAQ:USAP) to determine whether it could have potential as an investment idea. To be precise, we'll consider its Return On Capital Employed (ROCE), as that will inform our view of the quality of the business.
First, we'll go over how we calculate ROCE. Then we'll compare its ROCE to similar companies. Then we'll determine how its current liabilities are affecting its ROCE.
What is Return On Capital Employed (ROCE)?
ROCE is a metric for evaluating how much pre-tax income (in percentage terms) a company earns on the capital invested in its business. Generally speaking a higher ROCE is better. In brief, it is a useful tool, but it is not without drawbacks. Renowned investment researcher Michael Mauboussin has suggested that a high ROCE can indicate that 'one dollar invested in the company generates value of more than one dollar'.
So, How Do We Calculate ROCE?
Analysts use this formula to calculate return on capital employed:
Return on Capital Employed = Earnings Before Interest and Tax (EBIT) ÷ (Total Assets - Current Liabilities)
Or for Universal Stainless & Alloy Products:
0.023 = US$7.3m ÷ (US$368m - US$50m) (Based on the trailing twelve months to December 2019.)
So, Universal Stainless & Alloy Products has an ROCE of 2.3%.
See our latest analysis for Universal Stainless & Alloy Products
Does Universal Stainless & Alloy Products Have A Good ROCE?
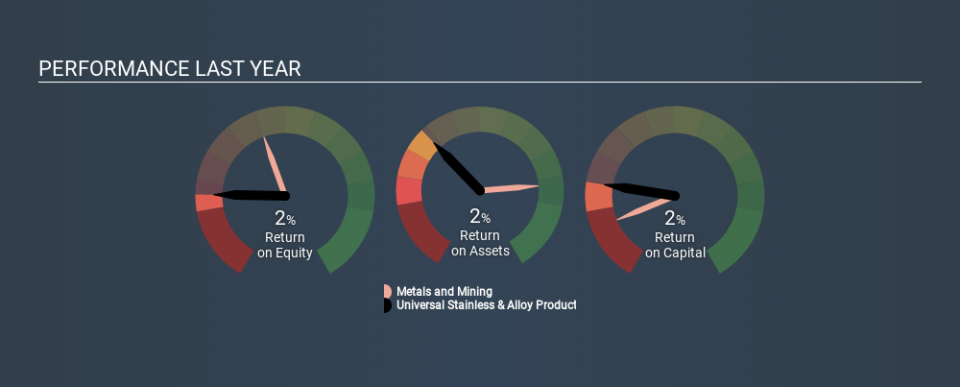
One way to assess ROCE is to compare similar companies. We can see Universal Stainless & Alloy Products's ROCE is meaningfully below the Metals and Mining industry average of 8.5%. This could be seen as a negative, as it suggests some competitors may be employing their capital more efficiently. Regardless of how Universal Stainless & Alloy Products stacks up against its industry, its ROCE in absolute terms is quite low (especially compared to a bank account). There are potentially more appealing investments elsewhere.
Universal Stainless & Alloy Products delivered an ROCE of 2.3%, which is better than 3 years ago, as was making losses back then. This makes us wonder if the company is improving. You can click on the image below to see (in greater detail) how Universal Stainless & Alloy Products's past growth compares to other companies.
When considering ROCE, bear in mind that it reflects the past and does not necessarily predict the future. ROCE can be misleading for companies in cyclical industries, with returns looking impressive during the boom times, but very weak during the busts. ROCE is only a point-in-time measure. We note Universal Stainless & Alloy Products could be considered a cyclical business. Since the future is so important for investors, you should check out our free report on analyst forecasts for Universal Stainless & Alloy Products.
Do Universal Stainless & Alloy Products's Current Liabilities Skew Its ROCE?
Liabilities, such as supplier bills and bank overdrafts, are referred to as current liabilities if they need to be paid within 12 months. The ROCE equation subtracts current liabilities from capital employed, so a company with a lot of current liabilities appears to have less capital employed, and a higher ROCE than otherwise. To check the impact of this, we calculate if a company has high current liabilities relative to its total assets.
Universal Stainless & Alloy Products has total assets of US$368m and current liabilities of US$50m. Therefore its current liabilities are equivalent to approximately 14% of its total assets. This is a modest level of current liabilities, which will have a limited impact on the ROCE.
What We Can Learn From Universal Stainless & Alloy Products's ROCE
While that is good to see, Universal Stainless & Alloy Products has a low ROCE and does not look attractive in this analysis. But note: make sure you look for a great company, not just the first idea you come across. So take a peek at this free list of interesting companies with strong recent earnings growth (and a P/E ratio below 20).
If you like to buy stocks alongside management, then you might just love this free list of companies. (Hint: insiders have been buying them).
If you spot an error that warrants correction, please contact the editor at editorial-team@simplywallst.com. This article by Simply Wall St is general in nature. It does not constitute a recommendation to buy or sell any stock, and does not take account of your objectives, or your financial situation. Simply Wall St has no position in the stocks mentioned.
We aim to bring you long-term focused research analysis driven by fundamental data. Note that our analysis may not factor in the latest price-sensitive company announcements or qualitative material. Thank you for reading.
