Is Shenzhen Investment Limited’s (HKG:604) Balance Sheet Strong Enough To Weather A Storm?

Want to participate in a short research study? Help shape the future of investing tools and receive a $20 prize!
Mid-caps stocks, like Shenzhen Investment Limited (HKG:604) with a market capitalization of HK$23b, aren’t the focus of most investors who prefer to direct their investments towards either large-cap or small-cap stocks. However, generally ignored mid-caps have historically delivered better risk-adjusted returns than the two other categories of stocks. 604’s financial liquidity and debt position will be analysed in this article, to get an idea of whether the company can fund opportunities for strategic growth and maintain strength through economic downturns. Don’t forget that this is a general and concentrated examination of Shenzhen Investment’s financial health, so you should conduct further analysis into 604 here.
Check out our latest analysis for Shenzhen Investment
How much cash does 604 generate through its operations?
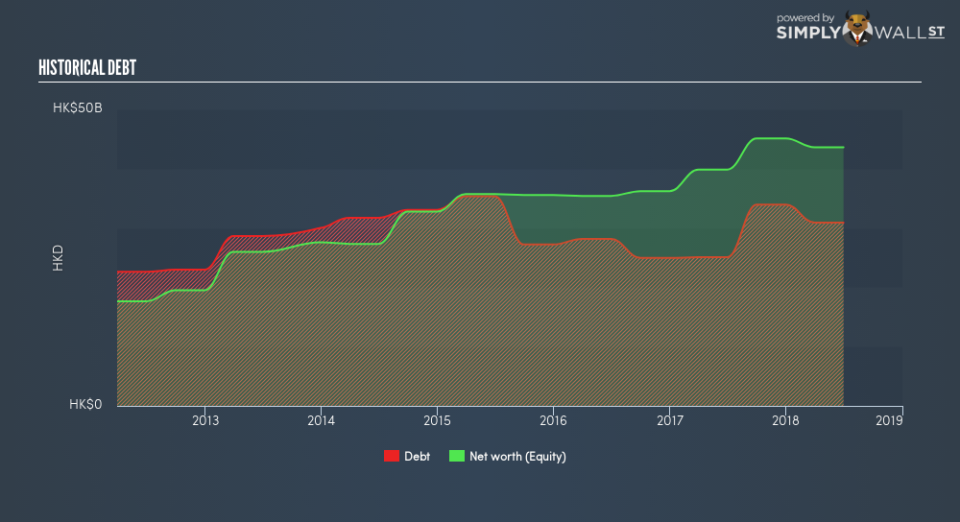
604’s debt levels surged from HK$25b to HK$31b over the last 12 months – this includes long-term debt. With this increase in debt, the current cash and short-term investment levels stands at HK$7.9b , ready to deploy into the business. Moving onto cash from operations, its small level of operating cash flow means calculating cash-to-debt wouldn’t be too useful, though these low levels of cash means that operational efficiency is worth a look. As the purpose of this article is a high-level overview, I won’t be looking at this today, but you can examine some of 604’s operating efficiency ratios such as ROA here.
Does 604’s liquid assets cover its short-term commitments?
With current liabilities at HK$41b, it appears that the company has been able to meet these obligations given the level of current assets of HK$59b, with a current ratio of 1.44x. Usually, for Real Estate companies, this is a suitable ratio since there is a bit of a cash buffer without leaving too much capital in a low-return environment.
Is 604’s debt level acceptable?
604 is a relatively highly levered company with a debt-to-equity of 71%. This is not unusual for mid-caps as debt tends to be a cheaper and faster source of funding for some businesses. We can check to see whether 604 is able to meet its debt obligations by looking at the net interest coverage ratio. A company generating earnings before interest and tax (EBIT) at least three times its net interest payments is considered financially sound. In 604’s, case, the ratio of 8.74x suggests that interest is appropriately covered, which means that lenders may be inclined to lend more money to the company, as it is seen as safe in terms of payback.
Next Steps:
604’s high cash coverage means that, although its debt levels are high, the company is able to utilise its borrowings efficiently in order to generate cash flow. Since there is also no concerns around 604’s liquidity needs, this may be its optimal capital structure for the time being. This is only a rough assessment of financial health, and I’m sure 604 has company-specific issues impacting its capital structure decisions. I recommend you continue to research Shenzhen Investment to get a more holistic view of the mid-cap by looking at:
Future Outlook: What are well-informed industry analysts predicting for 604’s future growth? Take a look at our free research report of analyst consensus for 604’s outlook.
Valuation: What is 604 worth today? Is the stock undervalued, even when its growth outlook is factored into its intrinsic value? The intrinsic value infographic in our free research report helps visualize whether 604 is currently mispriced by the market.
Other High-Performing Stocks: Are there other stocks that provide better prospects with proven track records? Explore our free list of these great stocks here.
We aim to bring you long-term focused research analysis driven by fundamental data. Note that our analysis may not factor in the latest price-sensitive company announcements or qualitative material.
If you spot an error that warrants correction, please contact the editor at editorial-team@simplywallst.com. This article by Simply Wall St is general in nature. It does not constitute a recommendation to buy or sell any stock, and does not take account of your objectives, or your financial situation. Simply Wall St has no position in the stocks mentioned. On rare occasion, data errors may occur. Thank you for reading.

