How Do Shun Wo Group Holdings Limited’s (HKG:1591) Returns On Capital Compare To Peers?

Today we’ll evaluate Shun Wo Group Holdings Limited (HKG:1591) to determine whether it could have potential as an investment idea. Specifically, we’re going to calculate its Return On Capital Employed (ROCE), in the hopes of getting some insight into the business.
First up, we’ll look at what ROCE is and how we calculate it. Next, we’ll compare it to others in its industry. And finally, we’ll look at how its current liabilities are impacting its ROCE.
What is Return On Capital Employed (ROCE)?
ROCE is a metric for evaluating how much pre-tax income (in percentage terms) a company earns on the capital invested in its business. Generally speaking a higher ROCE is better. In brief, it is a useful tool, but it is not without drawbacks. Author Edwin Whiting says to be careful when comparing the ROCE of different businesses, since ‘No two businesses are exactly alike.’
How Do You Calculate Return On Capital Employed?
Analysts use this formula to calculate return on capital employed:
Return on Capital Employed = Earnings Before Interest and Tax (EBIT) ÷ (Total Assets – Current Liabilities)
Or for Shun Wo Group Holdings:
0.025 = HK$4.5m ÷ (HK$180m – HK$15m) (Based on the trailing twelve months to September 2018.)
Therefore, Shun Wo Group Holdings has an ROCE of 2.5%.
View our latest analysis for Shun Wo Group Holdings
Want to help shape the future of investing tools and platforms? Take the survey and be part of one of the most advanced studies of stock market investors to date.
Does Shun Wo Group Holdings Have A Good ROCE?
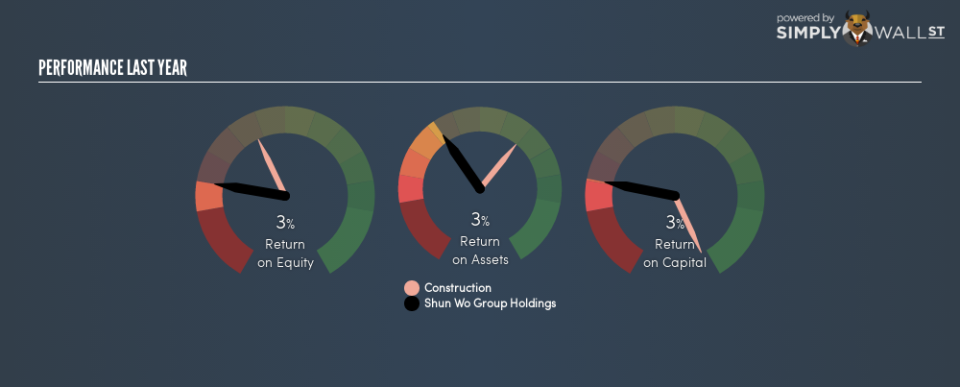
When making comparisons between similar businesses, investors may find ROCE useful. In this analysis, Shun Wo Group Holdings’s ROCE appears meaningfully below the 14% average reported by the Construction industry. This could be seen as a negative, as it suggests some competitors may be employing their capital more efficiently. Regardless of how Shun Wo Group Holdings stacks up against its industry, its ROCE in absolute terms is quite low (especially compared to a bank account). Readers may wish to look for more rewarding investments.
Shun Wo Group Holdings’s current ROCE of 2.5% is lower than its ROCE in the past, which was 55%, 3 years ago. So investors might consider if it has had issues recently.
It is important to remember that ROCE shows past performance, and is not necessarily predictive. Companies in cyclical industries can be difficult to understand using ROCE, as returns typically look high during boom times, and low during busts. ROCE is, after all, simply a snap shot of a single year. If Shun Wo Group Holdings is cyclical, it could make sense to check out this free graph of past earnings, revenue and cash flow.
Do Shun Wo Group Holdings’s Current Liabilities Skew Its ROCE?
Short term (or current) liabilities, are things like supplier invoices, overdrafts, or tax bills that need to be paid within 12 months. Due to the way the ROCE equation works, having large bills due in the near term can make it look as though a company has less capital employed, and thus a higher ROCE than usual. To counteract this, we check if a company has high current liabilities, relative to its total assets.
Shun Wo Group Holdings has total liabilities of HK$15m and total assets of HK$180m. Therefore its current liabilities are equivalent to approximately 8.4% of its total assets. Shun Wo Group Holdings has a low level of current liabilities, which have a negligible impact on its already low ROCE.
What We Can Learn From Shun Wo Group Holdings’s ROCE
Nevertheless, there are potentially more attractive companies to invest in. Of course you might be able to find a better stock than Shun Wo Group Holdings. So you may wish to see this free collection of other companies that have grown earnings strongly.
For those who like to find winning investments this free list of growing companies with recent insider purchasing, could be just the ticket.
To help readers see past the short term volatility of the financial market, we aim to bring you a long-term focused research analysis purely driven by fundamental data. Note that our analysis does not factor in the latest price-sensitive company announcements.
The author is an independent contributor and at the time of publication had no position in the stocks mentioned. For errors that warrant correction please contact the editor at editorial-team@simplywallst.com.
