Singapore Technologies Engineering Ltd (SGX:S63): Financial Strength Analysis

Mid-caps stocks, like Singapore Technologies Engineering Ltd (SGX:S63) with a market capitalization of S$12b, aren’t the focus of most investors who prefer to direct their investments towards either large-cap or small-cap stocks. However, generally ignored mid-caps have historically delivered better risk-adjusted returns than the two other categories of stocks. S63’s financial liquidity and debt position will be analysed in this article, to get an idea of whether the company can fund opportunities for strategic growth and maintain strength through economic downturns. Don’t forget that this is a general and concentrated examination of Singapore Technologies Engineering's financial health, so you should conduct further analysis into S63 here.
Want to participate in a short research study? Help shape the future of investing tools and you could win a $250 gift card!
View our latest analysis for Singapore Technologies Engineering
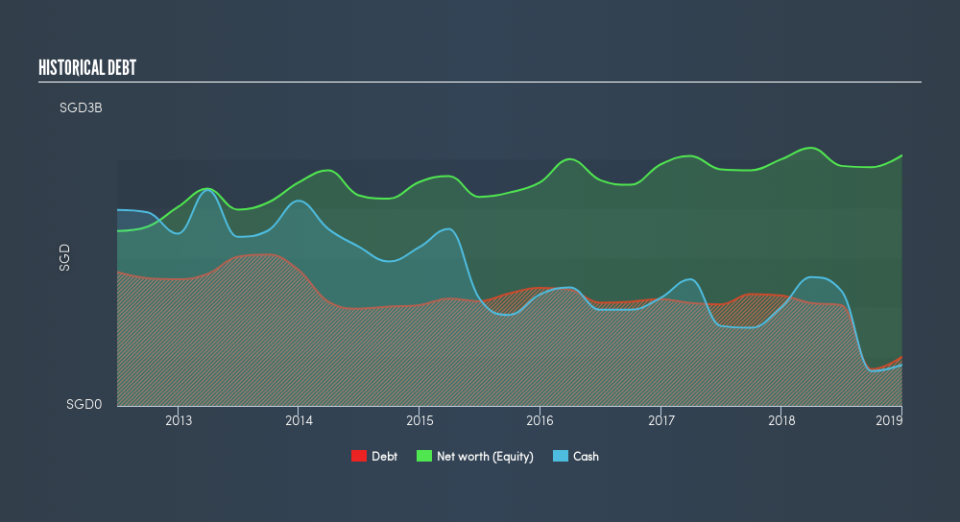
S63’s Debt (And Cash Flows)
S63's debt levels have fallen from S$1.1b to S$496m over the last 12 months , which includes long-term debt. With this reduction in debt, the current cash and short-term investment levels stands at S$415m , ready to be used for running the business. On top of this, S63 has generated cash from operations of S$639m in the last twelve months, resulting in an operating cash to total debt ratio of 129%, signalling that S63’s current level of operating cash is high enough to cover debt.
Does S63’s liquid assets cover its short-term commitments?
Looking at S63’s S$3.9b in current liabilities, the company has been able to meet these commitments with a current assets level of S$4.1b, leading to a 1.06x current account ratio. The current ratio is the number you get when you divide current assets by current liabilities. For Aerospace & Defense companies, this ratio is within a sensible range since there is a bit of a cash buffer without leaving too much capital in a low-return environment.
Does S63 face the risk of succumbing to its debt-load?
S63’s level of debt is appropriate relative to its total equity, at 20%. S63 is not taking on too much debt commitment, which can be restrictive and risky for equity-holders. We can test if S63’s debt levels are sustainable by measuring interest payments against earnings of a company. Ideally, earnings before interest and tax (EBIT) should cover net interest by at least three times. For S63, the ratio of 21.19x suggests that interest is comfortably covered, which means that debtors may be willing to loan the company more money, giving S63 ample headroom to grow its debt facilities.
Next Steps:
S63 has demonstrated its ability to generate sufficient levels of cash flow, while its debt hovers at a safe level. Furthermore, the company exhibits an ability to meet its near term obligations should an adverse event occur. I admit this is a fairly basic analysis for S63's financial health. Other important fundamentals need to be considered alongside. You should continue to research Singapore Technologies Engineering to get a more holistic view of the stock by looking at:
Future Outlook: What are well-informed industry analysts predicting for S63’s future growth? Take a look at our free research report of analyst consensus for S63’s outlook.
Valuation: What is S63 worth today? Is the stock undervalued, even when its growth outlook is factored into its intrinsic value? The intrinsic value infographic in our free research report helps visualize whether S63 is currently mispriced by the market.
Other High-Performing Stocks: Are there other stocks that provide better prospects with proven track records? Explore our free list of these great stocks here.
We aim to bring you long-term focused research analysis driven by fundamental data. Note that our analysis may not factor in the latest price-sensitive company announcements or qualitative material.
If you spot an error that warrants correction, please contact the editor at editorial-team@simplywallst.com. This article by Simply Wall St is general in nature. It does not constitute a recommendation to buy or sell any stock, and does not take account of your objectives, or your financial situation. Simply Wall St has no position in the stocks mentioned. Thank you for reading.

