Do Sinostar PEC Holdings Limited’s (SGX:C9Q) Returns On Capital Employed Make The Cut?

Today we are going to look at Sinostar PEC Holdings Limited (SGX:C9Q) to see whether it might be an attractive investment prospect. Specifically, we'll consider its Return On Capital Employed (ROCE), since that will give us an insight into how efficiently the business can generate profits from the capital it requires.
Firstly, we'll go over how we calculate ROCE. Next, we'll compare it to others in its industry. Finally, we'll look at how its current liabilities affect its ROCE.
Understanding Return On Capital Employed (ROCE)
ROCE is a metric for evaluating how much pre-tax income (in percentage terms) a company earns on the capital invested in its business. All else being equal, a better business will have a higher ROCE. Overall, it is a valuable metric that has its flaws. Renowned investment researcher Michael Mauboussin has suggested that a high ROCE can indicate that 'one dollar invested in the company generates value of more than one dollar'.
How Do You Calculate Return On Capital Employed?
The formula for calculating the return on capital employed is:
Return on Capital Employed = Earnings Before Interest and Tax (EBIT) ÷ (Total Assets - Current Liabilities)
Or for Sinostar PEC Holdings:
0.14 = CN¥141m ÷ (CN¥2.2b - CN¥1.2b) (Based on the trailing twelve months to March 2019.)
Therefore, Sinostar PEC Holdings has an ROCE of 14%.
Check out our latest analysis for Sinostar PEC Holdings
Does Sinostar PEC Holdings Have A Good ROCE?
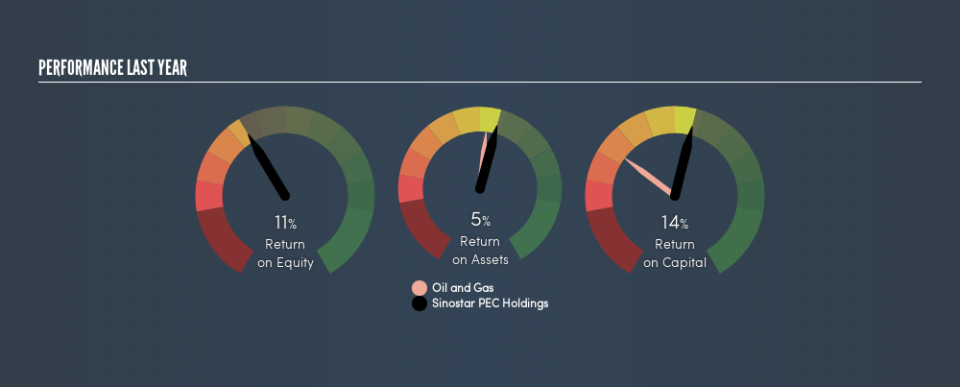
When making comparisons between similar businesses, investors may find ROCE useful. It appears that Sinostar PEC Holdings's ROCE is fairly close to the Oil and Gas industry average of 12%. Independently of how Sinostar PEC Holdings compares to its industry, its ROCE in absolute terms appears decent, and the company may be worthy of closer investigation.
Our data shows that Sinostar PEC Holdings currently has an ROCE of 14%, compared to its ROCE of 5.6% 3 years ago. This makes us think the business might be improving. The image below shows how Sinostar PEC Holdings's ROCE compares to its industry, and you can click it to see more detail on its past growth.
It is important to remember that ROCE shows past performance, and is not necessarily predictive. ROCE can be misleading for companies in cyclical industries, with returns looking impressive during the boom times, but very weak during the busts. This is because ROCE only looks at one year, instead of considering returns across a whole cycle. We note Sinostar PEC Holdings could be considered a cyclical business. If Sinostar PEC Holdings is cyclical, it could make sense to check out this free graph of past earnings, revenue and cash flow.
Do Sinostar PEC Holdings's Current Liabilities Skew Its ROCE?
Liabilities, such as supplier bills and bank overdrafts, are referred to as current liabilities if they need to be paid within 12 months. Due to the way the ROCE equation works, having large bills due in the near term can make it look as though a company has less capital employed, and thus a higher ROCE than usual. To check the impact of this, we calculate if a company has high current liabilities relative to its total assets.
Sinostar PEC Holdings has total liabilities of CN¥1.2b and total assets of CN¥2.2b. Therefore its current liabilities are equivalent to approximately 53% of its total assets. This is admittedly a high level of current liabilities, improving ROCE substantially.
The Bottom Line On Sinostar PEC Holdings's ROCE
This ROCE is pretty good, but remember that it would look less impressive with fewer current liabilities. Sinostar PEC Holdings shapes up well under this analysis, but it is far from the only business delivering excellent numbers . You might also want to check this free collection of companies delivering excellent earnings growth.
If you are like me, then you will not want to miss this free list of growing companies that insiders are buying.
We aim to bring you long-term focused research analysis driven by fundamental data. Note that our analysis may not factor in the latest price-sensitive company announcements or qualitative material.
If you spot an error that warrants correction, please contact the editor at editorial-team@simplywallst.com. This article by Simply Wall St is general in nature. It does not constitute a recommendation to buy or sell any stock, and does not take account of your objectives, or your financial situation. Simply Wall St has no position in the stocks mentioned. Thank you for reading.
