A Sliding Share Price Has Us Looking At Yue Yuen Industrial (Holdings) Limited's (HKG:551) P/E Ratio

To the annoyance of some shareholders, Yue Yuen Industrial (Holdings) (HKG:551) shares are down a considerable 31% in the last month. Indeed the recent decline has arguably caused some bitterness for shareholders who have held through the 47% drop over twelve months.
Assuming nothing else has changed, a lower share price makes a stock more attractive to potential buyers. In the long term, share prices tend to follow earnings per share, but in the short term prices bounce around in response to short term factors (which are not always obvious). The implication here is that long term investors have an opportunity when expectations of a company are too low. One way to gauge market expectations of a stock is to look at its Price to Earnings Ratio (PE Ratio). A high P/E ratio means that investors have a high expectation about future growth, while a low P/E ratio means they have low expectations about future growth.
Check out our latest analysis for Yue Yuen Industrial (Holdings)
How Does Yue Yuen Industrial (Holdings)'s P/E Ratio Compare To Its Peers?
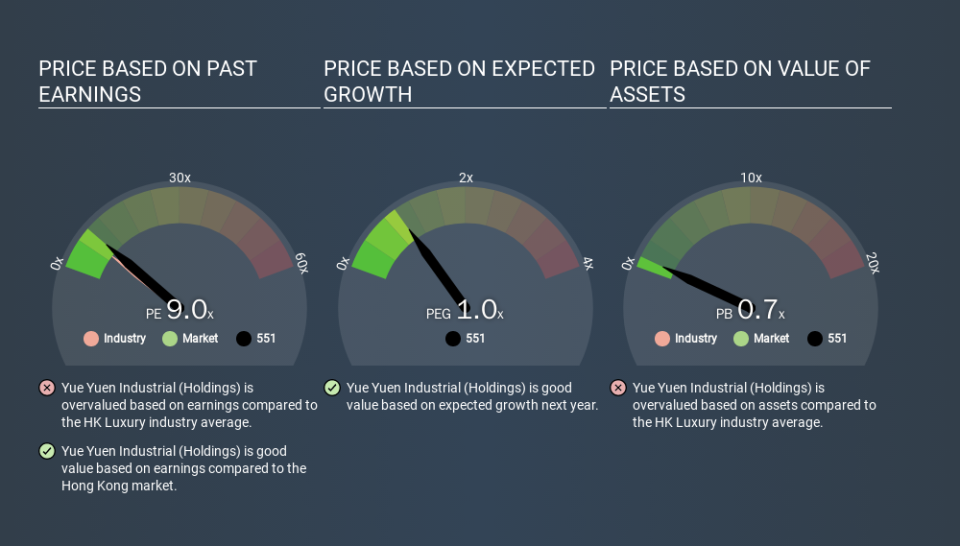
We can tell from its P/E ratio of 8.99 that there is some investor optimism about Yue Yuen Industrial (Holdings). You can see in the image below that the average P/E (7.5) for companies in the luxury industry is lower than Yue Yuen Industrial (Holdings)'s P/E.
That means that the market expects Yue Yuen Industrial (Holdings) will outperform other companies in its industry. Clearly the market expects growth, but it isn't guaranteed. So investors should delve deeper. I like to check if company insiders have been buying or selling.
How Growth Rates Impact P/E Ratios
Earnings growth rates have a big influence on P/E ratios. Earnings growth means that in the future the 'E' will be higher. That means unless the share price increases, the P/E will reduce in a few years. So while a stock may look expensive based on past earnings, it could be cheap based on future earnings.
Yue Yuen Industrial (Holdings) shrunk earnings per share by 6.0% last year.
A Limitation: P/E Ratios Ignore Debt and Cash In The Bank
The 'Price' in P/E reflects the market capitalization of the company. That means it doesn't take debt or cash into account. Theoretically, a business can improve its earnings (and produce a lower P/E in the future) by investing in growth. That means taking on debt (or spending its cash).
While growth expenditure doesn't always pay off, the point is that it is a good option to have; but one that the P/E ratio ignores.
How Does Yue Yuen Industrial (Holdings)'s Debt Impact Its P/E Ratio?
Yue Yuen Industrial (Holdings) has net debt equal to 39% of its market cap. You'd want to be aware of this fact, but it doesn't bother us.
The Verdict On Yue Yuen Industrial (Holdings)'s P/E Ratio
Yue Yuen Industrial (Holdings) trades on a P/E ratio of 9.0, which is fairly close to the HK market average of 9.2. Given it has some debt, but didn't grow last year, the P/E indicates the market is expecting higher profits ahead for the business. What can be absolutely certain is that the market has become more pessimistic about Yue Yuen Industrial (Holdings) over the last month, with the P/E ratio falling from 13.1 back then to 9.0 today. For those who prefer to invest with the flow of momentum, that might be a bad sign, but for deep value investors this stock might justify some research.
Investors should be looking to buy stocks that the market is wrong about. As value investor Benjamin Graham famously said, 'In the short run, the market is a voting machine but in the long run, it is a weighing machine. So this free visualization of the analyst consensus on future earnings could help you make the right decision about whether to buy, sell, or hold.
But note: Yue Yuen Industrial (Holdings) may not be the best stock to buy. So take a peek at this free list of interesting companies with strong recent earnings growth (and a P/E ratio below 20).
If you spot an error that warrants correction, please contact the editor at editorial-team@simplywallst.com. This article by Simply Wall St is general in nature. It does not constitute a recommendation to buy or sell any stock, and does not take account of your objectives, or your financial situation. Simply Wall St has no position in the stocks mentioned.
We aim to bring you long-term focused research analysis driven by fundamental data. Note that our analysis may not factor in the latest price-sensitive company announcements or qualitative material. Thank you for reading.
