A Sliding Share Price Has Us Looking At National Australia Bank Limited's (ASX:NAB) P/E Ratio

To the annoyance of some shareholders, National Australia Bank (ASX:NAB) shares are down a considerable 34% in the last month. Indeed the recent decline has arguably caused some bitterness for shareholders who have held through the 34% drop over twelve months.
All else being equal, a share price drop should make a stock more attractive to potential investors. While the market sentiment towards a stock is very changeable, in the long run, the share price will tend to move in the same direction as earnings per share. The implication here is that long term investors have an opportunity when expectations of a company are too low. Perhaps the simplest way to get a read on investors' expectations of a business is to look at its Price to Earnings Ratio (PE Ratio). A high P/E implies that investors have high expectations of what a company can achieve compared to a company with a low P/E ratio.
View our latest analysis for National Australia Bank
Does National Australia Bank Have A Relatively High Or Low P/E For Its Industry?
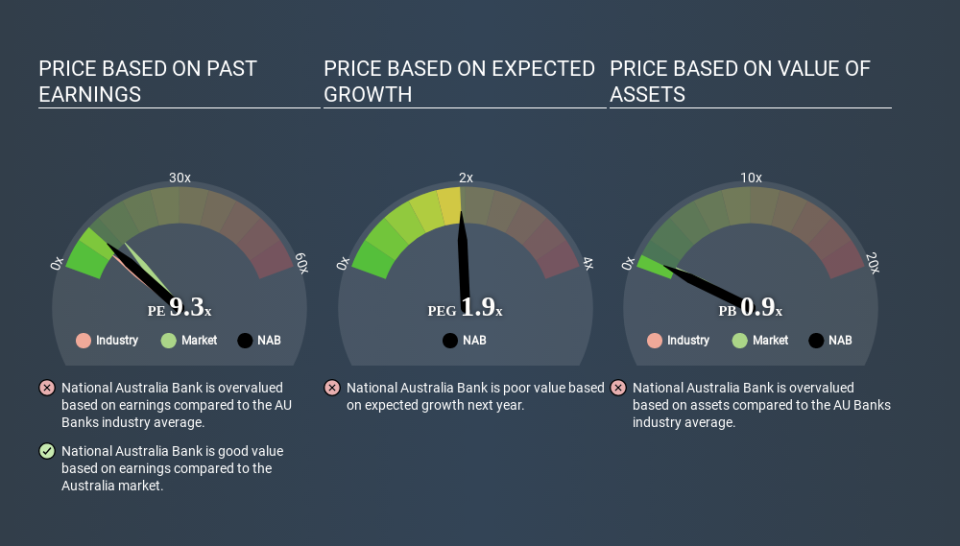
National Australia Bank's P/E of 9.32 indicates some degree of optimism towards the stock. The image below shows that National Australia Bank has a higher P/E than the average (7.8) P/E for companies in the banks industry.
Its relatively high P/E ratio indicates that National Australia Bank shareholders think it will perform better than other companies in its industry classification. Shareholders are clearly optimistic, but the future is always uncertain. So investors should always consider the P/E ratio alongside other factors, such as whether company directors have been buying shares.
How Growth Rates Impact P/E Ratios
Companies that shrink earnings per share quickly will rapidly decrease the 'E' in the equation. That means even if the current P/E is low, it will increase over time if the share price stays flat. A higher P/E should indicate the stock is expensive relative to others -- and that may encourage shareholders to sell.
National Australia Bank's earnings per share fell by 17% in the last twelve months. And EPS is down 3.5% a year, over the last 5 years. This might lead to muted expectations.
A Limitation: P/E Ratios Ignore Debt and Cash In The Bank
The 'Price' in P/E reflects the market capitalization of the company. So it won't reflect the advantage of cash, or disadvantage of debt. In theory, a company can lower its future P/E ratio by using cash or debt to invest in growth.
Such expenditure might be good or bad, in the long term, but the point here is that the balance sheet is not reflected by this ratio.
So What Does National Australia Bank's Balance Sheet Tell Us?
National Australia Bank's net debt is considerable, at 252% of its market cap. This is a relatively high level of debt, so the stock probably deserves a relatively low P/E ratio. Keep that in mind when comparing it to other companies.
The Verdict On National Australia Bank's P/E Ratio
National Australia Bank's P/E is 9.3 which is below average (12.9) in the AU market. Given meaningful debt, and a lack of recent growth, the market looks to be extrapolating this recent performance; reflecting low expectations for the future. What can be absolutely certain is that the market has become more pessimistic about National Australia Bank over the last month, with the P/E ratio falling from 14.0 back then to 9.3 today. For those who prefer to invest with the flow of momentum, that might be a bad sign, but for deep value investors this stock might justify some research.
When the market is wrong about a stock, it gives savvy investors an opportunity. As value investor Benjamin Graham famously said, 'In the short run, the market is a voting machine but in the long run, it is a weighing machine. So this free report on the analyst consensus forecasts could help you make a master move on this stock.
Of course, you might find a fantastic investment by looking at a few good candidates. So take a peek at this free list of companies with modest (or no) debt, trading on a P/E below 20.
If you spot an error that warrants correction, please contact the editor at editorial-team@simplywallst.com. This article by Simply Wall St is general in nature. It does not constitute a recommendation to buy or sell any stock, and does not take account of your objectives, or your financial situation. Simply Wall St has no position in the stocks mentioned.
We aim to bring you long-term focused research analysis driven by fundamental data. Note that our analysis may not factor in the latest price-sensitive company announcements or qualitative material. Thank you for reading.

