A Sliding Share Price Has Us Looking At Aperam S.A.'s (AMS:APAM) P/E Ratio

Unfortunately for some shareholders, the Aperam (AMS:APAM) share price has dived 36% in the last thirty days. The recent drop has obliterated the annual return, with the share price now down 25% over that longer period.
All else being equal, a share price drop should make a stock more attractive to potential investors. While the market sentiment towards a stock is very changeable, in the long run, the share price will tend to move in the same direction as earnings per share. The implication here is that long term investors have an opportunity when expectations of a company are too low. Perhaps the simplest way to get a read on investors' expectations of a business is to look at its Price to Earnings Ratio (PE Ratio). A high P/E implies that investors have high expectations of what a company can achieve compared to a company with a low P/E ratio.
See our latest analysis for Aperam
How Does Aperam's P/E Ratio Compare To Its Peers?
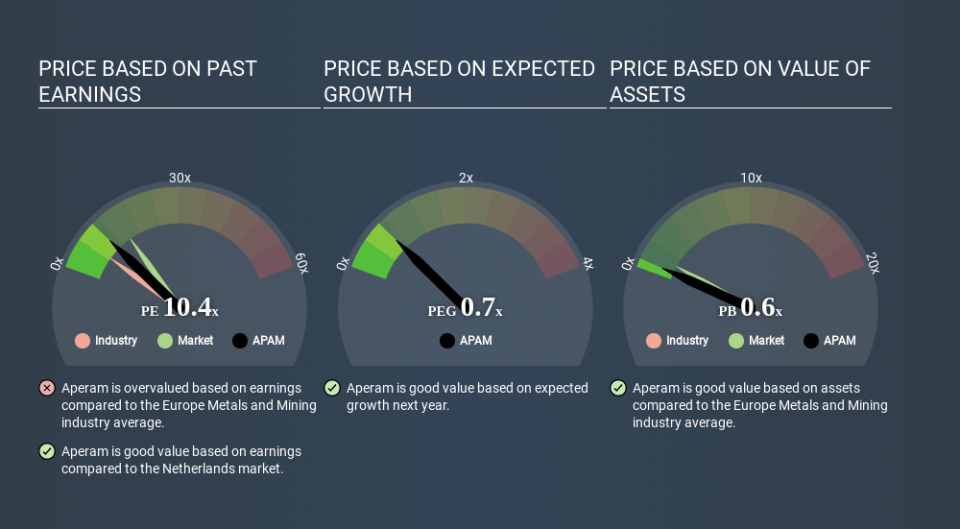
Aperam's P/E of 10.35 indicates some degree of optimism towards the stock. As you can see below, Aperam has a higher P/E than the average company (7.0) in the metals and mining industry.
Its relatively high P/E ratio indicates that Aperam shareholders think it will perform better than other companies in its industry classification. Clearly the market expects growth, but it isn't guaranteed. So investors should always consider the P/E ratio alongside other factors, such as whether company directors have been buying shares.
How Growth Rates Impact P/E Ratios
When earnings fall, the 'E' decreases, over time. That means even if the current P/E is low, it will increase over time if the share price stays flat. A higher P/E should indicate the stock is expensive relative to others -- and that may encourage shareholders to sell.
Aperam shrunk earnings per share by 46% over the last year. But over the longer term (5 years) earnings per share have increased by 13%. And it has shrunk its earnings per share by 11% per year over the last three years. This growth rate might warrant a low P/E ratio.
Remember: P/E Ratios Don't Consider The Balance Sheet
Don't forget that the P/E ratio considers market capitalization. Thus, the metric does not reflect cash or debt held by the company. Theoretically, a business can improve its earnings (and produce a lower P/E in the future) by investing in growth. That means taking on debt (or spending its cash).
Such spending might be good or bad, overall, but the key point here is that you need to look at debt to understand the P/E ratio in context.
How Does Aperam's Debt Impact Its P/E Ratio?
Net debt totals just 2.3% of Aperam's market cap. The market might award it a higher P/E ratio if it had net cash, but its unlikely this low level of net borrowing is having a big impact on the P/E multiple.
The Verdict On Aperam's P/E Ratio
Aperam trades on a P/E ratio of 10.4, which is below the NL market average of 15.0. With only modest debt, it's likely the lack of EPS growth at least partially explains the pessimism implied by the P/E ratio. What can be absolutely certain is that the market has become significantly less optimistic about Aperam over the last month, with the P/E ratio falling from 16.3 back then to 10.4 today. For those who prefer to invest with the flow of momentum, that might be a bad sign, but for a contrarian, it may signal opportunity.
Investors have an opportunity when market expectations about a stock are wrong. As value investor Benjamin Graham famously said, 'In the short run, the market is a voting machine but in the long run, it is a weighing machine. So this free visual report on analyst forecasts could hold the key to an excellent investment decision.
You might be able to find a better buy than Aperam. If you want a selection of possible winners, check out this free list of interesting companies that trade on a P/E below 20 (but have proven they can grow earnings).
If you spot an error that warrants correction, please contact the editor at editorial-team@simplywallst.com. This article by Simply Wall St is general in nature. It does not constitute a recommendation to buy or sell any stock, and does not take account of your objectives, or your financial situation. Simply Wall St has no position in the stocks mentioned.
We aim to bring you long-term focused research analysis driven by fundamental data. Note that our analysis may not factor in the latest price-sensitive company announcements or qualitative material. Thank you for reading.
