A Sliding Share Price Has Us Looking At Infineon Technologies AG's (ETR:IFX) P/E Ratio

Unfortunately for some shareholders, the Infineon Technologies (ETR:IFX) share price has dived 35% in the last thirty days. Even longer term holders have taken a real hit with the stock declining 24% in the last year.
All else being equal, a share price drop should make a stock more attractive to potential investors. In the long term, share prices tend to follow earnings per share, but in the short term prices bounce around in response to short term factors (which are not always obvious). So, on certain occasions, long term focussed investors try to take advantage of pessimistic expectations to buy shares at a better price. One way to gauge market expectations of a stock is to look at its Price to Earnings Ratio (PE Ratio). A high P/E implies that investors have high expectations of what a company can achieve compared to a company with a low P/E ratio.
See our latest analysis for Infineon Technologies
How Does Infineon Technologies's P/E Ratio Compare To Its Peers?
Infineon Technologies has a P/E ratio of 18.89. As you can see below Infineon Technologies has a P/E ratio that is fairly close for the average for the semiconductor industry, which is 18.8.
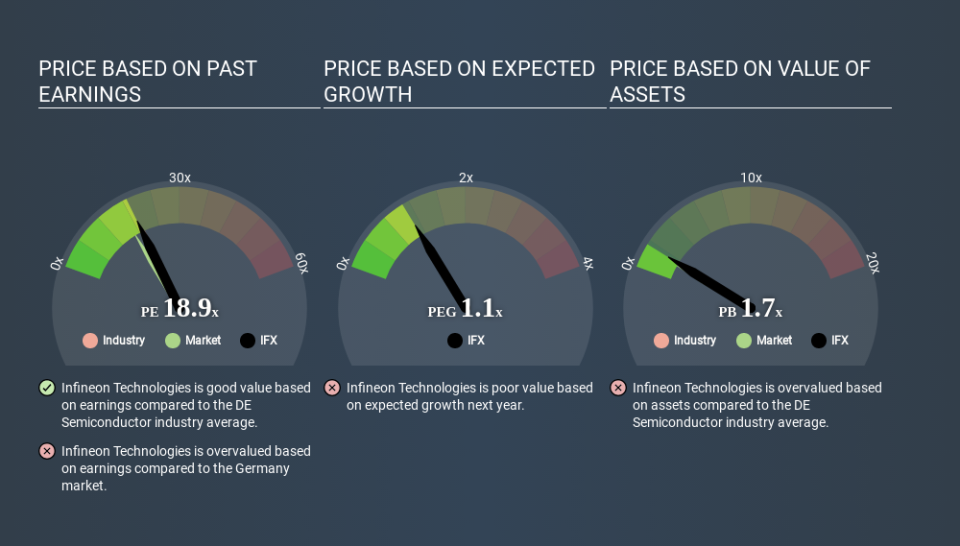
That indicates that the market expects Infineon Technologies will perform roughly in line with other companies in its industry. The company could surprise by performing better than average, in the future. I would further inform my view by checking insider buying and selling., among other things.
How Growth Rates Impact P/E Ratios
P/E ratios primarily reflect market expectations around earnings growth rates. When earnings grow, the 'E' increases, over time. Therefore, even if you pay a high multiple of earnings now, that multiple will become lower in the future. Then, a lower P/E should attract more buyers, pushing the share price up.
Infineon Technologies's earnings per share fell by 37% in the last twelve months. But over the longer term (5 years) earnings per share have increased by 8.4%.
Remember: P/E Ratios Don't Consider The Balance Sheet
It's important to note that the P/E ratio considers the market capitalization, not the enterprise value. Thus, the metric does not reflect cash or debt held by the company. Theoretically, a business can improve its earnings (and produce a lower P/E in the future) by investing in growth. That means taking on debt (or spending its cash).
Such spending might be good or bad, overall, but the key point here is that you need to look at debt to understand the P/E ratio in context.
Is Debt Impacting Infineon Technologies's P/E?
With net cash of €3.3b, Infineon Technologies has a very strong balance sheet, which may be important for its business. Having said that, at 20% of its market capitalization the cash hoard would contribute towards a higher P/E ratio.
The Verdict On Infineon Technologies's P/E Ratio
Infineon Technologies trades on a P/E ratio of 18.9, which is above its market average of 16.5. The recent drop in earnings per share would make some investors cautious, but the net cash position means the company has time to improve: and the high P/E suggests the market thinks it will. What can be absolutely certain is that the market has become significantly less optimistic about Infineon Technologies over the last month, with the P/E ratio falling from 29.0 back then to 18.9 today. For those who don't like to trade against momentum, that could be a warning sign, but a contrarian investor might want to take a closer look.
When the market is wrong about a stock, it gives savvy investors an opportunity. As value investor Benjamin Graham famously said, 'In the short run, the market is a voting machine but in the long run, it is a weighing machine. So this free visual report on analyst forecasts could hold the key to an excellent investment decision.
Of course you might be able to find a better stock than Infineon Technologies. So you may wish to see this free collection of other companies that have grown earnings strongly.
If you spot an error that warrants correction, please contact the editor at editorial-team@simplywallst.com. This article by Simply Wall St is general in nature. It does not constitute a recommendation to buy or sell any stock, and does not take account of your objectives, or your financial situation. Simply Wall St has no position in the stocks mentioned.
We aim to bring you long-term focused research analysis driven by fundamental data. Note that our analysis may not factor in the latest price-sensitive company announcements or qualitative material. Thank you for reading.

