A Sliding Share Price Has Us Looking At St. Modwen Properties PLC's (LON:SMP) P/E Ratio

To the annoyance of some shareholders, St. Modwen Properties (LON:SMP) shares are down a considerable 32% in the last month. Even longer term holders have taken a real hit with the stock declining 19% in the last year.
All else being equal, a share price drop should make a stock more attractive to potential investors. While the market sentiment towards a stock is very changeable, in the long run, the share price will tend to move in the same direction as earnings per share. So, on certain occasions, long term focussed investors try to take advantage of pessimistic expectations to buy shares at a better price. One way to gauge market expectations of a stock is to look at its Price to Earnings Ratio (PE Ratio). Investors have optimistic expectations of companies with higher P/E ratios, compared to companies with lower P/E ratios.
View our latest analysis for St. Modwen Properties
How Does St. Modwen Properties's P/E Ratio Compare To Its Peers?
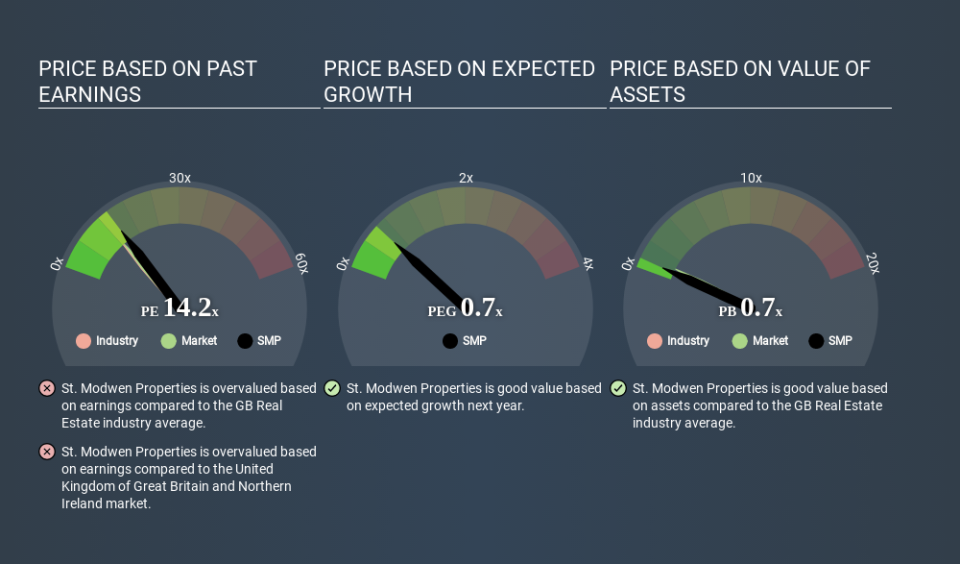
St. Modwen Properties's P/E of 14.19 indicates some degree of optimism towards the stock. As you can see below, St. Modwen Properties has a higher P/E than the average company (11.3) in the real estate industry.
Its relatively high P/E ratio indicates that St. Modwen Properties shareholders think it will perform better than other companies in its industry classification. Clearly the market expects growth, but it isn't guaranteed. So investors should delve deeper. I like to check if company insiders have been buying or selling.
How Growth Rates Impact P/E Ratios
When earnings fall, the 'E' decreases, over time. That means unless the share price falls, the P/E will increase in a few years. So while a stock may look cheap based on past earnings, it could be expensive based on future earnings.
St. Modwen Properties's earnings per share fell by 16% in the last twelve months. And it has shrunk its earnings per share by 16% per year over the last five years. This could justify a pessimistic P/E.
Remember: P/E Ratios Don't Consider The Balance Sheet
The 'Price' in P/E reflects the market capitalization of the company. Thus, the metric does not reflect cash or debt held by the company. The exact same company would hypothetically deserve a higher P/E ratio if it had a strong balance sheet, than if it had a weak one with lots of debt, because a cashed up company can spend on growth.
While growth expenditure doesn't always pay off, the point is that it is a good option to have; but one that the P/E ratio ignores.
Is Debt Impacting St. Modwen Properties's P/E?
St. Modwen Properties's net debt equates to 42% of its market capitalization. While that's enough to warrant consideration, it doesn't really concern us.
The Bottom Line On St. Modwen Properties's P/E Ratio
St. Modwen Properties has a P/E of 14.2. That's higher than the average in its market, which is 12.4. With a bit of debt, but a lack of recent growth, it's safe to say the market is expecting improved profit performance from the company, in the next few years. What can be absolutely certain is that the market has become significantly less optimistic about St. Modwen Properties over the last month, with the P/E ratio falling from 21.0 back then to 14.2 today. For those who don't like to trade against momentum, that could be a warning sign, but a contrarian investor might want to take a closer look.
When the market is wrong about a stock, it gives savvy investors an opportunity. If the reality for a company is better than it expects, you can make money by buying and holding for the long term. So this free visualization of the analyst consensus on future earnings could help you make the right decision about whether to buy, sell, or hold.
But note: St. Modwen Properties may not be the best stock to buy. So take a peek at this free list of interesting companies with strong recent earnings growth (and a P/E ratio below 20).
If you spot an error that warrants correction, please contact the editor at editorial-team@simplywallst.com. This article by Simply Wall St is general in nature. It does not constitute a recommendation to buy or sell any stock, and does not take account of your objectives, or your financial situation. Simply Wall St has no position in the stocks mentioned.
We aim to bring you long-term focused research analysis driven by fundamental data. Note that our analysis may not factor in the latest price-sensitive company announcements or qualitative material. Thank you for reading.
