A Sliding Share Price Has Us Looking At Cincinnati Bancorp's (NASDAQ:CNNB) P/E Ratio

Unfortunately for some shareholders, the Cincinnati Bancorp (NASDAQ:CNNB) share price has dived 36% in the last thirty days. Even longer term holders have taken a real hit with the stock declining 17% in the last year.
Assuming nothing else has changed, a lower share price makes a stock more attractive to potential buyers. In the long term, share prices tend to follow earnings per share, but in the short term prices bounce around in response to short term factors (which are not always obvious). The implication here is that long term investors have an opportunity when expectations of a company are too low. One way to gauge market expectations of a stock is to look at its Price to Earnings Ratio (PE Ratio). A high P/E implies that investors have high expectations of what a company can achieve compared to a company with a low P/E ratio.
View our latest analysis for Cincinnati Bancorp
How Does Cincinnati Bancorp's P/E Ratio Compare To Its Peers?
Cincinnati Bancorp's P/E is 13.03. You can see in the image below that the average P/E (14.1) for companies in the mortgage industry is roughly the same as Cincinnati Bancorp's P/E.
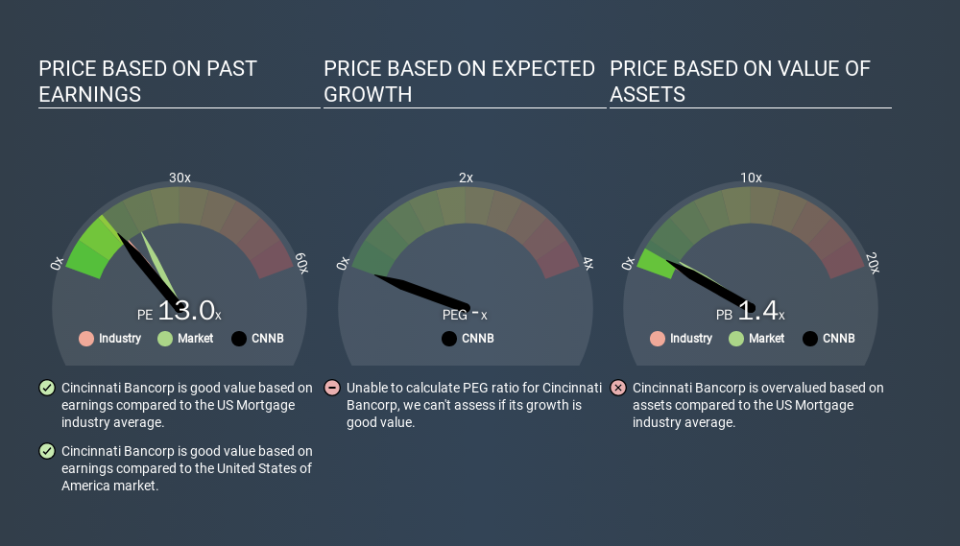
Cincinnati Bancorp's P/E tells us that market participants think its prospects are roughly in line with its industry. The company could surprise by performing better than average, in the future. Further research into factors such as insider buying and selling, could help you form your own view on whether that is likely.
How Growth Rates Impact P/E Ratios
P/E ratios primarily reflect market expectations around earnings growth rates. If earnings are growing quickly, then the 'E' in the equation will increase faster than it would otherwise. That means even if the current P/E is high, it will reduce over time if the share price stays flat. So while a stock may look expensive based on past earnings, it could be cheap based on future earnings.
Cincinnati Bancorp's earnings made like a rocket, taking off 189% last year. And earnings per share have improved by 55% annually, over the last three years. So you might say it really deserves to have an above-average P/E ratio.
Remember: P/E Ratios Don't Consider The Balance Sheet
The 'Price' in P/E reflects the market capitalization of the company. So it won't reflect the advantage of cash, or disadvantage of debt. In theory, a company can lower its future P/E ratio by using cash or debt to invest in growth.
Spending on growth might be good or bad a few years later, but the point is that the P/E ratio does not account for the option (or lack thereof).
So What Does Cincinnati Bancorp's Balance Sheet Tell Us?
Net debt totals a substantial 132% of Cincinnati Bancorp's market cap. If you want to compare its P/E ratio to other companies, you must keep in mind that these debt levels would usually warrant a relatively low P/E.
The Verdict On Cincinnati Bancorp's P/E Ratio
Cincinnati Bancorp's P/E is 13.0 which is below average (18.3) in the US market. The company may have significant debt, but EPS growth was good last year. If the company can continue to grow earnings, then the current P/E may be unjustifiably low. Given Cincinnati Bancorp's P/E ratio has declined from 20.4 to 13.0 in the last month, we know for sure that the market is significantly less confident about the business today, than it was back then. For those who don't like to trade against momentum, that could be a warning sign, but a contrarian investor might want to take a closer look.
Investors should be looking to buy stocks that the market is wrong about. If it is underestimating a company, investors can make money by buying and holding the shares until the market corrects itself. We don't have analyst forecasts, but you might want to assess this data-rich visualization of earnings, revenue and cash flow.
Of course you might be able to find a better stock than Cincinnati Bancorp. So you may wish to see this free collection of other companies that have grown earnings strongly.
If you spot an error that warrants correction, please contact the editor at editorial-team@simplywallst.com. This article by Simply Wall St is general in nature. It does not constitute a recommendation to buy or sell any stock, and does not take account of your objectives, or your financial situation. Simply Wall St has no position in the stocks mentioned.
We aim to bring you long-term focused research analysis driven by fundamental data. Note that our analysis may not factor in the latest price-sensitive company announcements or qualitative material. Thank you for reading.
