A Sliding Share Price Has Us Looking At Raven Industries, Inc.'s (NASDAQ:RAVN) P/E Ratio

Unfortunately for some shareholders, the Raven Industries (NASDAQ:RAVN) share price has dived 30% in the last thirty days. That drop has capped off a tough year for shareholders, with the share price down 49% in that time.
Assuming nothing else has changed, a lower share price makes a stock more attractive to potential buyers. While the market sentiment towards a stock is very changeable, in the long run, the share price will tend to move in the same direction as earnings per share. So, on certain occasions, long term focussed investors try to take advantage of pessimistic expectations to buy shares at a better price. One way to gauge market expectations of a stock is to look at its Price to Earnings Ratio (PE Ratio). A high P/E ratio means that investors have a high expectation about future growth, while a low P/E ratio means they have low expectations about future growth.
Check out our latest analysis for Raven Industries
How Does Raven Industries's P/E Ratio Compare To Its Peers?
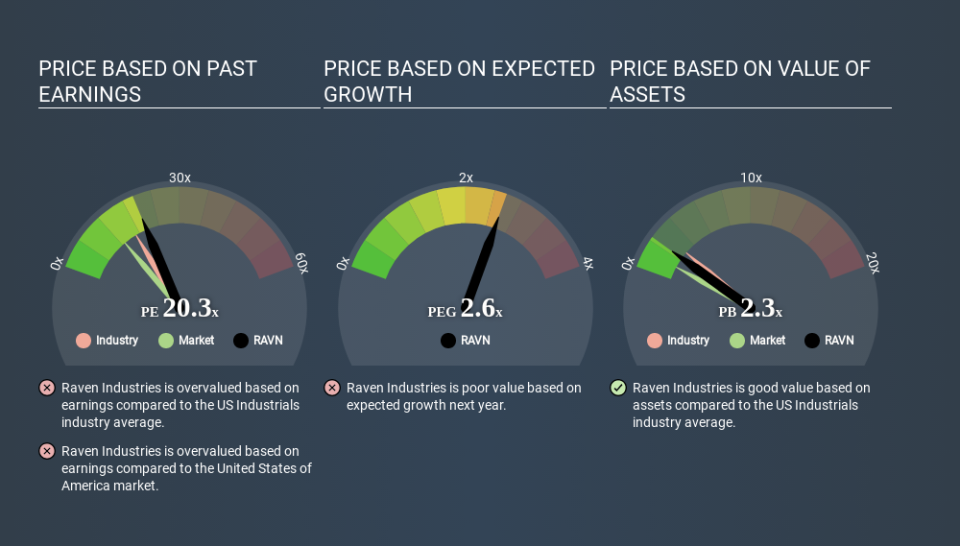
We can tell from its P/E ratio of 20.28 that there is some investor optimism about Raven Industries. As you can see below, Raven Industries has a higher P/E than the average company (16.8) in the industrials industry.
That means that the market expects Raven Industries will outperform other companies in its industry. The market is optimistic about the future, but that doesn't guarantee future growth. So further research is always essential. I often monitor director buying and selling.
How Growth Rates Impact P/E Ratios
Probably the most important factor in determining what P/E a company trades on is the earnings growth. When earnings grow, the 'E' increases, over time. Therefore, even if you pay a high multiple of earnings now, that multiple will become lower in the future. So while a stock may look expensive based on past earnings, it could be cheap based on future earnings.
Raven Industries's earnings per share fell by 32% in the last twelve months. But it has grown its earnings per share by 2.6% per year over the last five years.
Don't Forget: The P/E Does Not Account For Debt or Bank Deposits
The 'Price' in P/E reflects the market capitalization of the company. In other words, it does not consider any debt or cash that the company may have on the balance sheet. In theory, a company can lower its future P/E ratio by using cash or debt to invest in growth.
Such expenditure might be good or bad, in the long term, but the point here is that the balance sheet is not reflected by this ratio.
Is Debt Impacting Raven Industries's P/E?
Since Raven Industries holds net cash of US$20m, it can spend on growth, justifying a higher P/E ratio than otherwise.
The Verdict On Raven Industries's P/E Ratio
Raven Industries's P/E is 20.3 which is above average (12.9) in its market. The recent drop in earnings per share might keep value investors away, but the relatively strong balance sheet will allow the company time to invest in growth. Clearly, the high P/E indicates shareholders think it will! What can be absolutely certain is that the market has become significantly less optimistic about Raven Industries over the last month, with the P/E ratio falling from 29.1 back then to 20.3 today. For those who prefer to invest with the flow of momentum, that might be a bad sign, but for a contrarian, it may signal opportunity.
Investors have an opportunity when market expectations about a stock are wrong. If the reality for a company is better than it expects, you can make money by buying and holding for the long term. So this free report on the analyst consensus forecasts could help you make a master move on this stock.
Of course, you might find a fantastic investment by looking at a few good candidates. So take a peek at this free list of companies with modest (or no) debt, trading on a P/E below 20.
If you spot an error that warrants correction, please contact the editor at editorial-team@simplywallst.com. This article by Simply Wall St is general in nature. It does not constitute a recommendation to buy or sell any stock, and does not take account of your objectives, or your financial situation. Simply Wall St has no position in the stocks mentioned.
We aim to bring you long-term focused research analysis driven by fundamental data. Note that our analysis may not factor in the latest price-sensitive company announcements or qualitative material. Thank you for reading.
