A Sliding Share Price Has Us Looking At Royal Caribbean Cruises Ltd.'s (NYSE:RCL) P/E Ratio

To the annoyance of some shareholders, Royal Caribbean Cruises (NYSE:RCL) shares are down a considerable 37% in the last month. That drop has capped off a tough year for shareholders, with the share price down 35% in that time.
All else being equal, a share price drop should make a stock more attractive to potential investors. In the long term, share prices tend to follow earnings per share, but in the short term prices bounce around in response to short term factors (which are not always obvious). The implication here is that long term investors have an opportunity when expectations of a company are too low. Perhaps the simplest way to get a read on investors' expectations of a business is to look at its Price to Earnings Ratio (PE Ratio). Investors have optimistic expectations of companies with higher P/E ratios, compared to companies with lower P/E ratios.
See our latest analysis for Royal Caribbean Cruises
How Does Royal Caribbean Cruises's P/E Ratio Compare To Its Peers?
Royal Caribbean Cruises's P/E of 8.58 indicates relatively low sentiment towards the stock. If you look at the image below, you can see Royal Caribbean Cruises has a lower P/E than the average (21.1) in the hospitality industry classification.
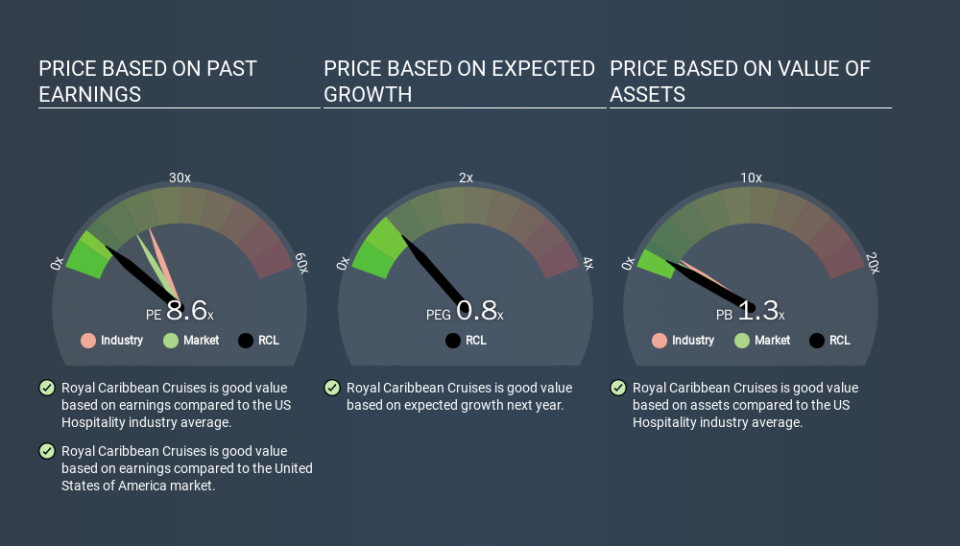
This suggests that market participants think Royal Caribbean Cruises will underperform other companies in its industry. Many investors like to buy stocks when the market is pessimistic about their prospects. You should delve deeper. I like to check if company insiders have been buying or selling.
How Growth Rates Impact P/E Ratios
Earnings growth rates have a big influence on P/E ratios. If earnings are growing quickly, then the 'E' in the equation will increase faster than it would otherwise. And in that case, the P/E ratio itself will drop rather quickly. Then, a lower P/E should attract more buyers, pushing the share price up.
Royal Caribbean Cruises increased earnings per share by 4.3% last year. And its annual EPS growth rate over 5 years is 21%.
Remember: P/E Ratios Don't Consider The Balance Sheet
It's important to note that the P/E ratio considers the market capitalization, not the enterprise value. In other words, it does not consider any debt or cash that the company may have on the balance sheet. In theory, a company can lower its future P/E ratio by using cash or debt to invest in growth.
Such expenditure might be good or bad, in the long term, but the point here is that the balance sheet is not reflected by this ratio.
So What Does Royal Caribbean Cruises's Balance Sheet Tell Us?
Royal Caribbean Cruises's net debt is 67% of its market cap. This is a reasonably significant level of debt -- all else being equal you'd expect a much lower P/E than if it had net cash.
The Verdict On Royal Caribbean Cruises's P/E Ratio
Royal Caribbean Cruises has a P/E of 8.6. That's below the average in the US market, which is 16.9. While the recent EPS growth is a positive, the significant amount of debt on the balance sheet may be contributing to pessimistic market expectations. Given Royal Caribbean Cruises's P/E ratio has declined from 13.6 to 8.6 in the last month, we know for sure that the market is more worried about the business today, than it was back then. For those who prefer to invest with the flow of momentum, that might be a bad sign, but for deep value investors this stock might justify some research.
When the market is wrong about a stock, it gives savvy investors an opportunity. If it is underestimating a company, investors can make money by buying and holding the shares until the market corrects itself. So this free visualization of the analyst consensus on future earnings could help you make the right decision about whether to buy, sell, or hold.
Of course, you might find a fantastic investment by looking at a few good candidates. So take a peek at this free list of companies with modest (or no) debt, trading on a P/E below 20.
If you spot an error that warrants correction, please contact the editor at editorial-team@simplywallst.com. This article by Simply Wall St is general in nature. It does not constitute a recommendation to buy or sell any stock, and does not take account of your objectives, or your financial situation. Simply Wall St has no position in the stocks mentioned.
We aim to bring you long-term focused research analysis driven by fundamental data. Note that our analysis may not factor in the latest price-sensitive company announcements or qualitative material. Thank you for reading.
