A Sliding Share Price Has Us Looking At McMillan Shakespeare Limited's (ASX:MMS) P/E Ratio

To the annoyance of some shareholders, McMillan Shakespeare (ASX:MMS) shares are down a considerable 43% in the last month. Indeed the recent decline has arguably caused some bitterness for shareholders who have held through the 46% drop over twelve months.
Assuming nothing else has changed, a lower share price makes a stock more attractive to potential buyers. While the market sentiment towards a stock is very changeable, in the long run, the share price will tend to move in the same direction as earnings per share. The implication here is that long term investors have an opportunity when expectations of a company are too low. Perhaps the simplest way to get a read on investors' expectations of a business is to look at its Price to Earnings Ratio (PE Ratio). Investors have optimistic expectations of companies with higher P/E ratios, compared to companies with lower P/E ratios.
Check out our latest analysis for McMillan Shakespeare
Does McMillan Shakespeare Have A Relatively High Or Low P/E For Its Industry?
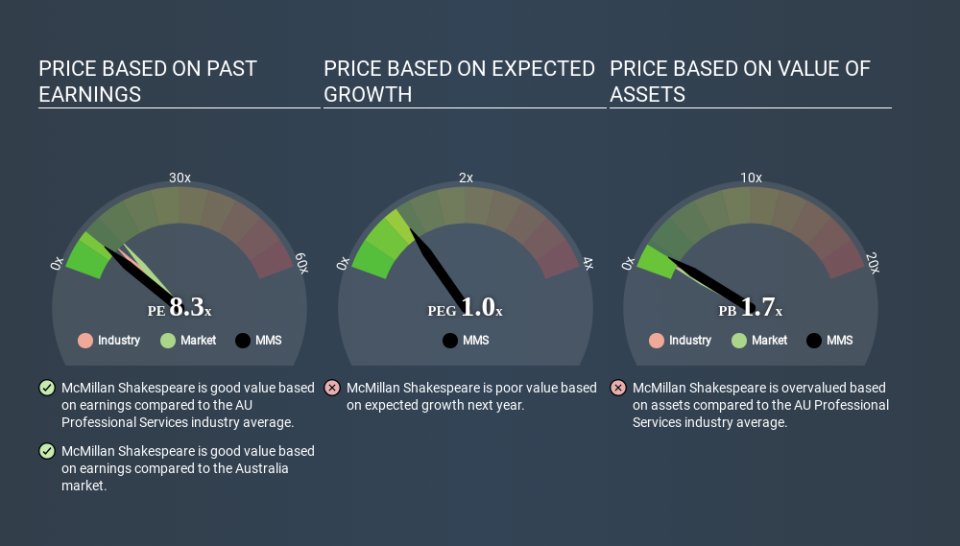
McMillan Shakespeare's P/E of 8.29 indicates relatively low sentiment towards the stock. The image below shows that McMillan Shakespeare has a lower P/E than the average (10.3) P/E for companies in the professional services industry.
McMillan Shakespeare's P/E tells us that market participants think it will not fare as well as its peers in the same industry. Since the market seems unimpressed with McMillan Shakespeare, it's quite possible it could surprise on the upside. It is arguably worth checking if insiders are buying shares, because that might imply they believe the stock is undervalued.
How Growth Rates Impact P/E Ratios
When earnings fall, the 'E' decreases, over time. Therefore, even if you pay a low multiple of earnings now, that multiple will become higher in the future. A higher P/E should indicate the stock is expensive relative to others -- and that may encourage shareholders to sell.
Notably, McMillan Shakespeare grew EPS by a whopping 30% in the last year. In contrast, EPS has decreased by 2.7%, annually, over 5 years.
Remember: P/E Ratios Don't Consider The Balance Sheet
One drawback of using a P/E ratio is that it considers market capitalization, but not the balance sheet. That means it doesn't take debt or cash into account. The exact same company would hypothetically deserve a higher P/E ratio if it had a strong balance sheet, than if it had a weak one with lots of debt, because a cashed up company can spend on growth.
Such spending might be good or bad, overall, but the key point here is that you need to look at debt to understand the P/E ratio in context.
Is Debt Impacting McMillan Shakespeare's P/E?
McMillan Shakespeare has net debt worth 55% of its market capitalization. This is enough debt that you'd have to make some adjustments before using the P/E ratio to compare it to a company with net cash.
The Verdict On McMillan Shakespeare's P/E Ratio
McMillan Shakespeare's P/E is 8.3 which is below average (12.5) in the AU market. The company has a meaningful amount of debt on the balance sheet, but that should not eclipse the solid earnings growth. The low P/E ratio suggests current market expectations are muted, implying these levels of growth will not continue. What can be absolutely certain is that the market has become more pessimistic about McMillan Shakespeare over the last month, with the P/E ratio falling from 14.6 back then to 8.3 today. For those who prefer to invest with the flow of momentum, that might be a bad sign, but for deep value investors this stock might justify some research.
When the market is wrong about a stock, it gives savvy investors an opportunity. As value investor Benjamin Graham famously said, 'In the short run, the market is a voting machine but in the long run, it is a weighing machine. So this free report on the analyst consensus forecasts could help you make a master move on this stock.
Of course, you might find a fantastic investment by looking at a few good candidates. So take a peek at this free list of companies with modest (or no) debt, trading on a P/E below 20.
If you spot an error that warrants correction, please contact the editor at editorial-team@simplywallst.com. This article by Simply Wall St is general in nature. It does not constitute a recommendation to buy or sell any stock, and does not take account of your objectives, or your financial situation. Simply Wall St has no position in the stocks mentioned.
We aim to bring you long-term focused research analysis driven by fundamental data. Note that our analysis may not factor in the latest price-sensitive company announcements or qualitative material. Thank you for reading.

