Is SM Energy Company's (NYSE:SM) Balance Sheet Strong Enough To Weather A Storm?

Investors are always looking for growth in small-cap stocks like SM Energy Company (NYSE:SM), with a market cap of US$2.0b. However, an important fact which most ignore is: how financially healthy is the business? Understanding the company's financial health becomes essential, since poor capital management may bring about bankruptcies, which occur at a higher rate for small-caps. Let's work through some financial health checks you may wish to consider if you're interested in this stock. However, potential investors would need to take a closer look, and I recommend you dig deeper yourself into SM here.
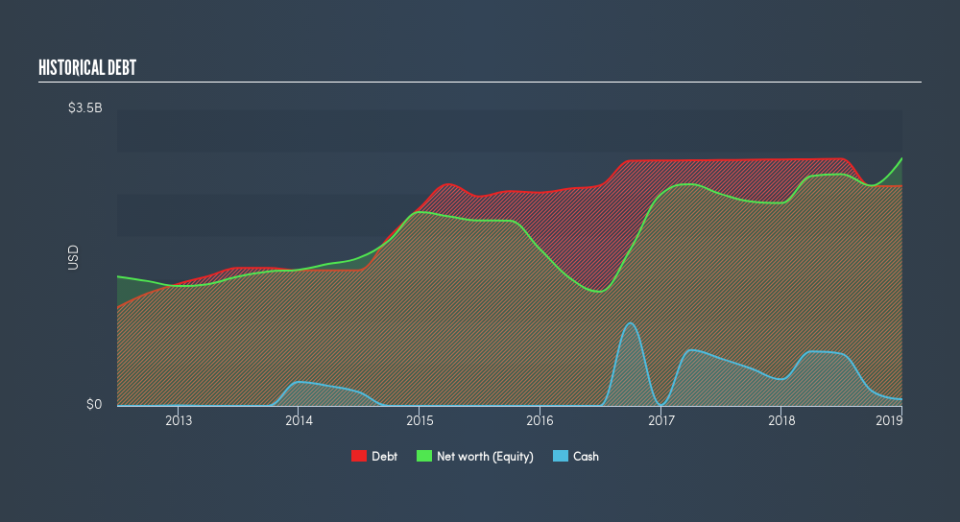
SM’s Debt (And Cash Flows)
SM has shrunk its total debt levels in the last twelve months, from US$2.9b to US$2.6b , which also accounts for long term debt. With this debt repayment, the current cash and short-term investment levels stands at US$78m to keep the business going. Moreover, SM has generated cash from operations of US$721m in the last twelve months, leading to an operating cash to total debt ratio of 28%, signalling that SM’s operating cash is sufficient to cover its debt.
Can SM meet its short-term obligations with the cash in hand?
Looking at SM’s US$466m in current liabilities, the company may not have an easy time meeting these commitments with a current assets level of US$429m, leading to a current ratio of 0.92x. The current ratio is the number you get when you divide current assets by current liabilities.
Is SM’s debt level acceptable?
SM is a relatively highly levered company with a debt-to-equity of 89%. This is somewhat unusual for small-caps companies, since lenders are often hesitant to provide attractive interest rates to less-established businesses. We can test if SM’s debt levels are sustainable by measuring interest payments against earnings of a company. Ideally, earnings before interest and tax (EBIT) should cover net interest by at least three times. For SM, the ratio of 2.63x suggests that interest is not strongly covered, which means that lenders may refuse to lend the company more money, as it is seen as too risky in terms of default.
Next Steps:
SM’s high cash coverage means that, although its debt levels are high, the company is able to utilise its borrowings efficiently in order to generate cash flow. But, its lack of liquidity raises questions over current asset management practices for the small-cap. Keep in mind I haven't considered other factors such as how SM has been performing in the past. I suggest you continue to research SM Energy to get a more holistic view of the stock by looking at:
Future Outlook: What are well-informed industry analysts predicting for SM’s future growth? Take a look at our free research report of analyst consensus for SM’s outlook.
Valuation: What is SM worth today? Is the stock undervalued, even when its growth outlook is factored into its intrinsic value? The intrinsic value infographic in our free research report helps visualize whether SM is currently mispriced by the market.
Other High-Performing Stocks: Are there other stocks that provide better prospects with proven track records? Explore our free list of these great stocks here.
We aim to bring you long-term focused research analysis driven by fundamental data. Note that our analysis may not factor in the latest price-sensitive company announcements or qualitative material.
If you spot an error that warrants correction, please contact the editor at editorial-team@simplywallst.com. This article by Simply Wall St is general in nature. It does not constitute a recommendation to buy or sell any stock, and does not take account of your objectives, or your financial situation. Simply Wall St has no position in the stocks mentioned. Thank you for reading.
