Should Spartan Motors, Inc.’s (NASDAQ:SPAR) Weak Investment Returns Worry You?

Today we are going to look at Spartan Motors, Inc. (NASDAQ:SPAR) to see whether it might be an attractive investment prospect. Specifically, we're going to calculate its Return On Capital Employed (ROCE), in the hopes of getting some insight into the business.
Firstly, we'll go over how we calculate ROCE. Second, we'll look at its ROCE compared to similar companies. Finally, we'll look at how its current liabilities affect its ROCE.
Understanding Return On Capital Employed (ROCE)
ROCE measures the 'return' (pre-tax profit) a company generates from capital employed in its business. Generally speaking a higher ROCE is better. Overall, it is a valuable metric that has its flaws. Author Edwin Whiting says to be careful when comparing the ROCE of different businesses, since 'No two businesses are exactly alike.
So, How Do We Calculate ROCE?
Analysts use this formula to calculate return on capital employed:
Return on Capital Employed = Earnings Before Interest and Tax (EBIT) ÷ (Total Assets - Current Liabilities)
Or for Spartan Motors:
0.062 = US$22m ÷ (US$513m - US$167m) (Based on the trailing twelve months to September 2019.)
Therefore, Spartan Motors has an ROCE of 6.2%.
View our latest analysis for Spartan Motors
Does Spartan Motors Have A Good ROCE?
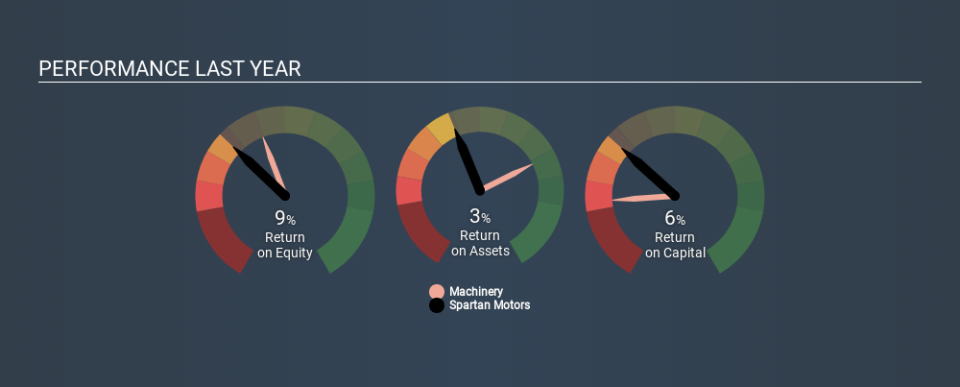
ROCE is commonly used for comparing the performance of similar businesses. Using our data, Spartan Motors's ROCE appears to be significantly below the 11% average in the Machinery industry. This could be seen as a negative, as it suggests some competitors may be employing their capital more efficiently. Separate from how Spartan Motors stacks up against its industry, its ROCE in absolute terms is mediocre; relative to the returns on government bonds. It is possible that there are more rewarding investments out there.
Our data shows that Spartan Motors currently has an ROCE of 6.2%, compared to its ROCE of 0.7% 3 years ago. This makes us think about whether the company has been reinvesting shrewdly. The image below shows how Spartan Motors's ROCE compares to its industry, and you can click it to see more detail on its past growth.
It is important to remember that ROCE shows past performance, and is not necessarily predictive. ROCE can be deceptive for cyclical businesses, as returns can look incredible in boom times, and terribly low in downturns. This is because ROCE only looks at one year, instead of considering returns across a whole cycle. Future performance is what matters, and you can see analyst predictions in our free report on analyst forecasts for the company.
Do Spartan Motors's Current Liabilities Skew Its ROCE?
Liabilities, such as supplier bills and bank overdrafts, are referred to as current liabilities if they need to be paid within 12 months. Due to the way the ROCE equation works, having large bills due in the near term can make it look as though a company has less capital employed, and thus a higher ROCE than usual. To check the impact of this, we calculate if a company has high current liabilities relative to its total assets.
Spartan Motors has total assets of US$513m and current liabilities of US$167m. Therefore its current liabilities are equivalent to approximately 33% of its total assets. Spartan Motors's middling level of current liabilities have the effect of boosting its ROCE a bit.
Our Take On Spartan Motors's ROCE
With this level of liabilities and a mediocre ROCE, there are potentially better investments out there. Of course, you might also be able to find a better stock than Spartan Motors. So you may wish to see this free collection of other companies that have grown earnings strongly.
If you are like me, then you will not want to miss this free list of growing companies that insiders are buying.
If you spot an error that warrants correction, please contact the editor at editorial-team@simplywallst.com. This article by Simply Wall St is general in nature. It does not constitute a recommendation to buy or sell any stock, and does not take account of your objectives, or your financial situation. Simply Wall St has no position in the stocks mentioned.
We aim to bring you long-term focused research analysis driven by fundamental data. Note that our analysis may not factor in the latest price-sensitive company announcements or qualitative material. Thank you for reading.

