A Spotlight On SSY Group Limited's (HKG:2005) Fundamentals

SSY Group Limited (HKG:2005) is a stock with outstanding fundamental characteristics. When we build an investment case, we need to look at the stock with a holistic perspective. In the case of 2005, it is a financially-healthy company with a great history and a excellent growth outlook. Below is a brief commentary on these key aspects. For those interested in digging a bit deeper into my commentary, read the full report on SSY Group here.
Flawless balance sheet with outstanding track record
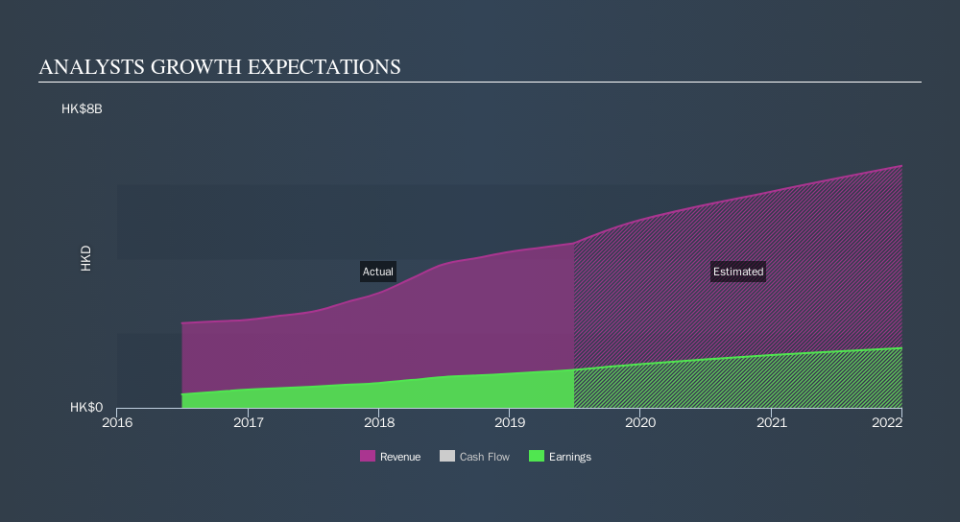
2005’s cash-generating ability is outstanding, with analysts expecting its operating cash flows to more than double in the upcoming year. This is expected to flow down into an impressive return on equity of 24% over the next couple of years. In the previous year, 2005 has ramped up its bottom line by 23%, with its latest earnings level surpassing its average level over the last five years. The strong earnings growth is reflected in impressive double-digit 21% return to shareholders, which paints a buoyant picture for the company.
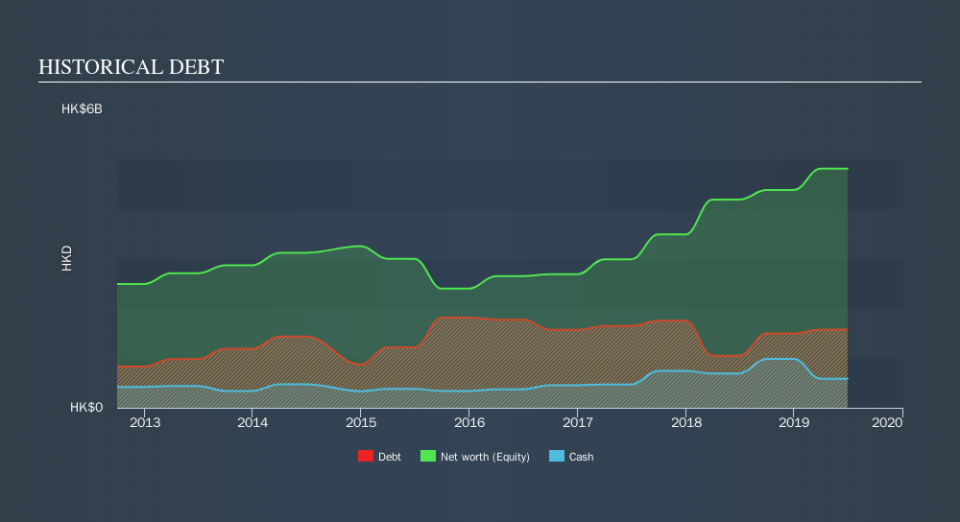
2005's ability to maintain an adequate level of cash to meet upcoming liabilities is a good sign for its financial health. This indicates that 2005 has sufficient cash flows and proper cash management in place, which is a key determinant of the company’s health. 2005 appears to have made good use of debt, producing operating cash levels of 0.39x total debt in the prior year. This is a strong indication that debt is reasonably met with cash generated.
Next Steps:
For SSY Group, there are three fundamental factors you should look at:
Valuation: What is 2005 worth today? Is the stock undervalued, even when its growth outlook is factored into its intrinsic value? The intrinsic value infographic in our free research report helps visualize whether 2005 is currently mispriced by the market.
Dividend Income vs Capital Gains: Does 2005 return gains to shareholders through reinvesting in itself and growing earnings, or redistribute a decent portion of earnings as dividends? Our historical dividend yield visualization quickly tells you what your can expect from 2005 as an investment.
Other Attractive Alternatives : Are there other well-rounded stocks you could be holding instead of 2005? Explore our interactive list of stocks with large potential to get an idea of what else is out there you may be missing!
We aim to bring you long-term focused research analysis driven by fundamental data. Note that our analysis may not factor in the latest price-sensitive company announcements or qualitative material.
If you spot an error that warrants correction, please contact the editor at editorial-team@simplywallst.com. This article by Simply Wall St is general in nature. It does not constitute a recommendation to buy or sell any stock, and does not take account of your objectives, or your financial situation. Simply Wall St has no position in the stocks mentioned. Thank you for reading.
