SPX Hasn't Been This Wild in Nearly a Year
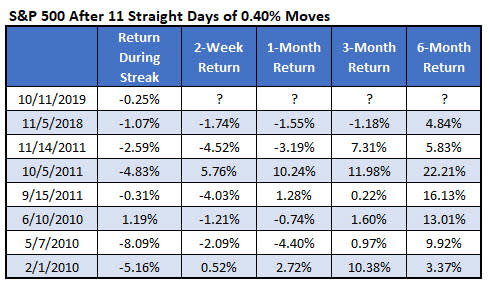
It's been a wild October so far for the stock market, as investors have reacted to Fed buzz and updates on U.S.-China trade negotiations. In fact, from Sept. 27 to last Friday, Oct. 11, the S&P 500 Index (SPX) moved at least 0.4% every single session, regardless of direction. That's the first 11-day streak of notable moves in more than 11 months, and only the second such volatility streak since 2011.
Specifically, the last time the S&P moved 0.4% for at least 11 consecutive sessions was in November 2018, during which the index fell 1.07% on its way to the December lows, per data from Schaeffer's Senior Quantitative Analyst Rocky White. During the most recent streak, the SPX essentially went nowhere, losing just 0.25% when all was said and done. Prior to November 2018, you'd have to go back seven years for a similar streak, of which there were three in both 2011 and 2010. Below are the returns after all streaks since 2010.
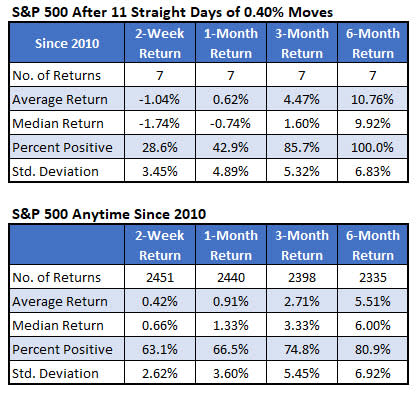
After at least 11 straight days of 0.4% swings, the SPX tends to underperform in the short term, looking at data since 2010. On average, the index fell 1.04% over the next two weeks, and was higher just once (in June 2010). That's compared to an average anytime two-week gain of 0.42% for the SPX. A month out, the SPX was higher by 0.62%, on average, though that still underwhelms compared to its average anytime one-month gain of 0.91%.
However, the tide tends to shift in the bulls' favor once you get to three months out. Following a lengthier-than-usual bout of big daily moves, the SPX was up 4.47%, on average, at the three-month marker, and higher 85.7% of the time. That's compared to an average anytime return of 2.71%, with a win rate of just under 75%.
Likewise, six months after a volatility jump, the S&P was up 10.76%, on average -- roughly double its average anytime return of 5.51%. What's more, the stock market index was in the black every single time six months after these streaks, compared to 80.9% anytime.
Looking even further back, the short-term outlook for stocks is brighter. There have been 37 similar volatility streaks for the SPX since 1950. Two weeks out, the index was up an average of 1.14% -- more than triple its average anytime return of 0.34% during the same time frame. Plus, one month later, the S&P averaged a gain of 1.45%, compared to 0.71% anytime.

In conclusion, recent history suggests the S&P could be in for another bumpy few weeks. However, as Schaeffer's Senior V.P. of Research Todd Salamone wrote earlier today, a couple of factors could be supportive of stocks in the weeks ahead, including "the contrarian implications of low earnings expectations as we move into earnings season" this week, and a possible "unwinding of the six-month build in short interest" that could push the SPX above the top of its range.

