How Do Sree Rayalaseema Hi-Strength Hypo Limited’s (NSE:SRHHYPOLTD) Returns Compare To Its Industry?

Today we are going to look at Sree Rayalaseema Hi-Strength Hypo Limited (NSE:SRHHYPOLTD) to see whether it might be an attractive investment prospect. Specifically, we're going to calculate its Return On Capital Employed (ROCE), in the hopes of getting some insight into the business.
Firstly, we'll go over how we calculate ROCE. Next, we'll compare it to others in its industry. Finally, we'll look at how its current liabilities affect its ROCE.
Understanding Return On Capital Employed (ROCE)
ROCE measures the amount of pre-tax profits a company can generate from the capital employed in its business. In general, businesses with a higher ROCE are usually better quality. In brief, it is a useful tool, but it is not without drawbacks. Renowned investment researcher Michael Mauboussin has suggested that a high ROCE can indicate that 'one dollar invested in the company generates value of more than one dollar'.
So, How Do We Calculate ROCE?
The formula for calculating the return on capital employed is:
Return on Capital Employed = Earnings Before Interest and Tax (EBIT) ÷ (Total Assets - Current Liabilities)
Or for Sree Rayalaseema Hi-Strength Hypo:
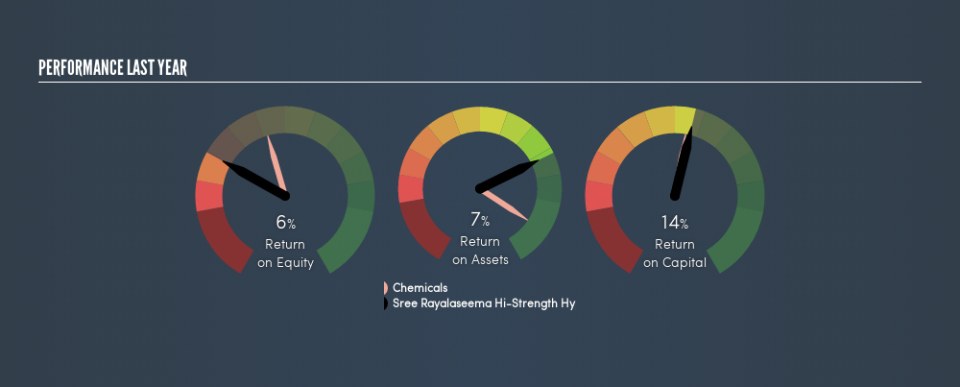
0.14 = ₹480m ÷ (₹4.7b - ₹1.2b) (Based on the trailing twelve months to March 2019.)
Therefore, Sree Rayalaseema Hi-Strength Hypo has an ROCE of 14%.
Check out our latest analysis for Sree Rayalaseema Hi-Strength Hypo
Does Sree Rayalaseema Hi-Strength Hypo Have A Good ROCE?
One way to assess ROCE is to compare similar companies. We can see Sree Rayalaseema Hi-Strength Hypo's ROCE is meaningfully below the Chemicals industry average of 18%. This performance is not ideal, as it suggests the company may not be deploying its capital as effectively as some competitors. Aside from the industry comparison, Sree Rayalaseema Hi-Strength Hypo's ROCE is mediocre in absolute terms, considering the risk of investing in stocks versus the safety of a bank account. Investors may wish to consider higher-performing investments.
The image below shows how Sree Rayalaseema Hi-Strength Hypo's ROCE compares to its industry, and you can click it to see more detail on its past growth.
When considering this metric, keep in mind that it is backwards looking, and not necessarily predictive. Companies in cyclical industries can be difficult to understand using ROCE, as returns typically look high during boom times, and low during busts. This is because ROCE only looks at one year, instead of considering returns across a whole cycle. You can check if Sree Rayalaseema Hi-Strength Hypo has cyclical profits by looking at this free graph of past earnings, revenue and cash flow.
Sree Rayalaseema Hi-Strength Hypo's Current Liabilities And Their Impact On Its ROCE
Liabilities, such as supplier bills and bank overdrafts, are referred to as current liabilities if they need to be paid within 12 months. Due to the way ROCE is calculated, a high level of current liabilities makes a company look as though it has less capital employed, and thus can (sometimes unfairly) boost the ROCE. To counteract this, we check if a company has high current liabilities, relative to its total assets.
Sree Rayalaseema Hi-Strength Hypo has total liabilities of ₹1.2b and total assets of ₹4.7b. As a result, its current liabilities are equal to approximately 25% of its total assets. This is a modest level of current liabilities, which would only have a small effect on ROCE.
The Bottom Line On Sree Rayalaseema Hi-Strength Hypo's ROCE
If Sree Rayalaseema Hi-Strength Hypo continues to earn an uninspiring ROCE, there may be better places to invest. But note: make sure you look for a great company, not just the first idea you come across. So take a peek at this free list of interesting companies with strong recent earnings growth (and a P/E ratio below 20).
If you are like me, then you will not want to miss this free list of growing companies that insiders are buying.
We aim to bring you long-term focused research analysis driven by fundamental data. Note that our analysis may not factor in the latest price-sensitive company announcements or qualitative material.
If you spot an error that warrants correction, please contact the editor at editorial-team@simplywallst.com. This article by Simply Wall St is general in nature. It does not constitute a recommendation to buy or sell any stock, and does not take account of your objectives, or your financial situation. Simply Wall St has no position in the stocks mentioned. Thank you for reading.

