Do You Like Sreeleathers Limited (NSE:SREEL) At This P/E Ratio?

Want to participate in a short research study? Help shape the future of investing tools and you could win a $250 gift card!
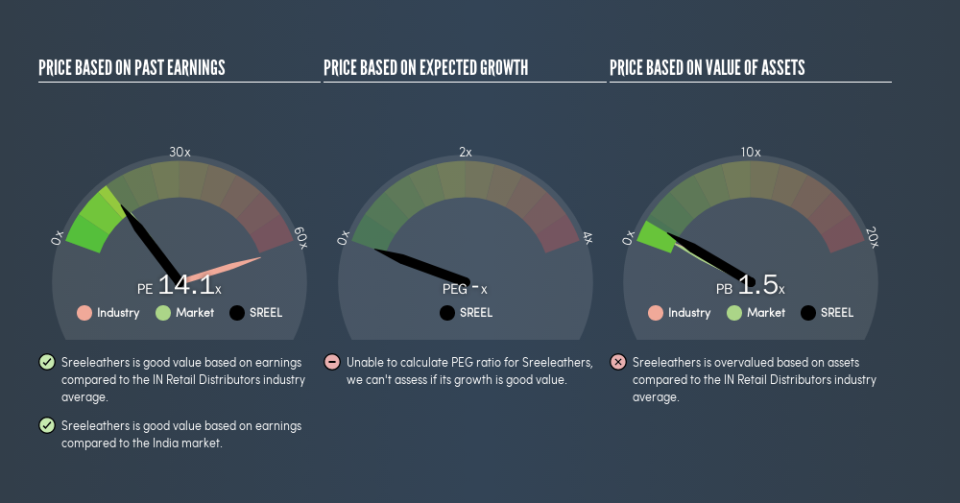
The goal of this article is to teach you how to use price to earnings ratios (P/E ratios). We'll show how you can use Sreeleathers Limited's (NSE:SREEL) P/E ratio to inform your assessment of the investment opportunity. What is Sreeleathers's P/E ratio? Well, based on the last twelve months it is 14.08. In other words, at today's prices, investors are paying ₹14.08 for every ₹1 in prior year profit.
View our latest analysis for Sreeleathers
How Do You Calculate A P/E Ratio?
The formula for price to earnings is:
Price to Earnings Ratio = Price per Share ÷ Earnings per Share (EPS)
Or for Sreeleathers:
P/E of 14.08 = ₹174 ÷ ₹12.36 (Based on the year to March 2019.)
Is A High P/E Ratio Good?
A higher P/E ratio means that investors are paying a higher price for each ₹1 of company earnings. That isn't necessarily good or bad, but a high P/E implies relatively high expectations of what a company can achieve in the future.
How Does Sreeleathers's P/E Ratio Compare To Its Peers?
One good way to get a quick read on what market participants expect of a company is to look at its P/E ratio. We can see in the image below that the average P/E (71.3) for companies in the retail distributors industry is higher than Sreeleathers's P/E.
This suggests that market participants think Sreeleathers will underperform other companies in its industry. Since the market seems unimpressed with Sreeleathers, it's quite possible it could surprise on the upside. If you consider the stock interesting, further research is recommended. For example, I often monitor director buying and selling.
How Growth Rates Impact P/E Ratios
Earnings growth rates have a big influence on P/E ratios. If earnings are growing quickly, then the 'E' in the equation will increase faster than it would otherwise. And in that case, the P/E ratio itself will drop rather quickly. And as that P/E ratio drops, the company will look cheap, unless its share price increases.
It's nice to see that Sreeleathers grew EPS by a stonking 45% in the last year. And it has bolstered its earnings per share by 34% per year over the last five years. So we'd generally expect it to have a relatively high P/E ratio.
A Limitation: P/E Ratios Ignore Debt and Cash In The Bank
The 'Price' in P/E reflects the market capitalization of the company. In other words, it does not consider any debt or cash that the company may have on the balance sheet. Hypothetically, a company could reduce its future P/E ratio by spending its cash (or taking on debt) to achieve higher earnings.
Spending on growth might be good or bad a few years later, but the point is that the P/E ratio does not account for the option (or lack thereof).
How Does Sreeleathers's Debt Impact Its P/E Ratio?
Since Sreeleathers holds net cash of ₹61m, it can spend on growth, justifying a higher P/E ratio than otherwise.
The Verdict On Sreeleathers's P/E Ratio
Sreeleathers has a P/E of 14.1. That's around the same as the average in the IN market, which is 15. Its net cash position is the cherry on top of its superb EPS growth. So based on this analysis we'd expect Sreeleathers to have a higher P/E ratio.
Investors should be looking to buy stocks that the market is wrong about. If it is underestimating a company, investors can make money by buying and holding the shares until the market corrects itself. Although we don't have analyst forecasts, you might want to assess this data-rich visualization of earnings, revenue and cash flow.
Of course you might be able to find a better stock than Sreeleathers. So you may wish to see this free collection of other companies that have grown earnings strongly.
We aim to bring you long-term focused research analysis driven by fundamental data. Note that our analysis may not factor in the latest price-sensitive company announcements or qualitative material.
If you spot an error that warrants correction, please contact the editor at editorial-team@simplywallst.com. This article by Simply Wall St is general in nature. It does not constitute a recommendation to buy or sell any stock, and does not take account of your objectives, or your financial situation. Simply Wall St has no position in the stocks mentioned. Thank you for reading.
