Is Starlite Holdings (HKG:403) Using Debt In A Risky Way?

Some say volatility, rather than debt, is the best way to think about risk as an investor, but Warren Buffett famously said that 'Volatility is far from synonymous with risk. It's only natural to consider a company's balance sheet when you examine how risky it is, since debt is often involved when a business collapses. As with many other companies Starlite Holdings Limited (HKG:403) makes use of debt. But the more important question is: how much risk is that debt creating?
Why Does Debt Bring Risk?
Generally speaking, debt only becomes a real problem when a company can't easily pay it off, either by raising capital or with its own cash flow. Part and parcel of capitalism is the process of 'creative destruction' where failed businesses are mercilessly liquidated by their bankers. However, a more common (but still painful) scenario is that it has to raise new equity capital at a low price, thus permanently diluting shareholders. Having said that, the most common situation is where a company manages its debt reasonably well - and to its own advantage. When we examine debt levels, we first consider both cash and debt levels, together.
Check out our latest analysis for Starlite Holdings
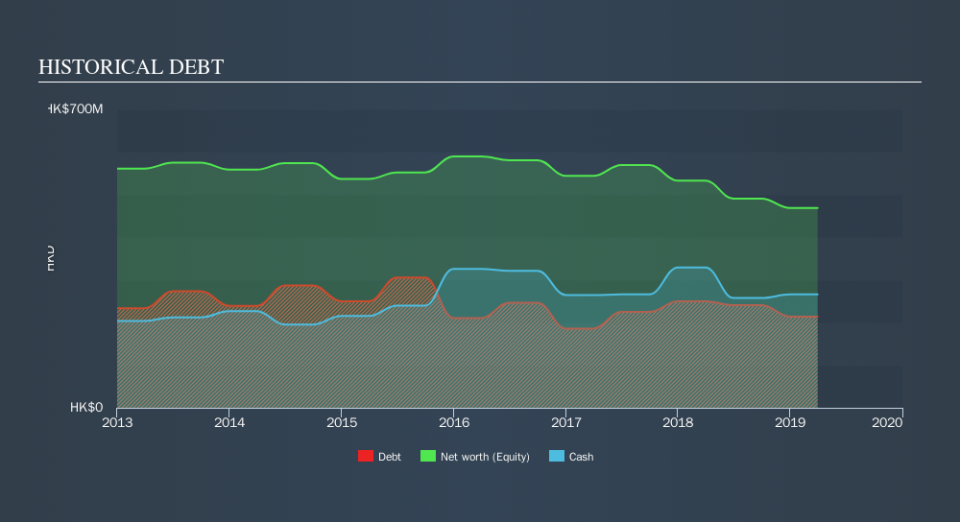
What Is Starlite Holdings's Debt?
The image below, which you can click on for greater detail, shows that Starlite Holdings had debt of HK$214.1m at the end of March 2019, a reduction from HK$250.0m over a year. But on the other hand it also has HK$265.9m in cash, leading to a HK$51.8m net cash position.
How Healthy Is Starlite Holdings's Balance Sheet?
According to the last reported balance sheet, Starlite Holdings had liabilities of HK$540.4m due within 12 months, and liabilities of HK$7.28m due beyond 12 months. Offsetting this, it had HK$265.9m in cash and HK$214.8m in receivables that were due within 12 months. So it has liabilities totalling HK$67.0m more than its cash and near-term receivables, combined.
While this might seem like a lot, it is not so bad since Starlite Holdings has a market capitalization of HK$173.3m, and so it could probably strengthen its balance sheet by raising capital if it needed to. But it's clear that we should definitely closely examine whether it can manage its debt without dilution. Despite its noteworthy liabilities, Starlite Holdings boasts net cash, so it's fair to say it does not have a heavy debt load! When analysing debt levels, the balance sheet is the obvious place to start. But you can't view debt in total isolation; since Starlite Holdings will need earnings to service that debt. So if you're keen to discover more about its earnings, it might be worth checking out this graph of its long term earnings trend.
In the last year Starlite Holdings had negative earnings before interest and tax, and actually shrunk its revenue by 6.7%, to HK$1.4b. That's not what we would hope to see.
So How Risky Is Starlite Holdings?
Statistically speaking companies that lose money are riskier than those that make money. And we do note that Starlite Holdings had negative earnings before interest and tax (EBIT), over the last year. Indeed, in that time it burnt through HK$19m of cash and made a loss of HK$38m. While this does make the company a bit risky, it's important to remember it has net cash of HK$51.8m. That means it could keep spending at its current rate for more than two years. Overall, we'd say the stock is a bit risky, and we're usually very cautious until we see positive free cash flow. For riskier companies like Starlite Holdings I always like to keep an eye on the long term profit and revenue trends. Fortunately, you can click to see our interactive graph of its profit, revenue, and operating cashflow.
If you're interested in investing in businesses that can grow profits without the burden of debt, then check out this free list of growing businesses that have net cash on the balance sheet.
We aim to bring you long-term focused research analysis driven by fundamental data. Note that our analysis may not factor in the latest price-sensitive company announcements or qualitative material.
If you spot an error that warrants correction, please contact the editor at editorial-team@simplywallst.com. This article by Simply Wall St is general in nature. It does not constitute a recommendation to buy or sell any stock, and does not take account of your objectives, or your financial situation. Simply Wall St has no position in the stocks mentioned. Thank you for reading.

