Stock Market Bottom Could Be In According To This Midterm Elections Seasonality Chart
S&P 500 has dropped more than 18% year-to-date and currently still move within a typical down channel forming lower high and lower low as of the close of last Friday. The stock market sentiment during last week is fluctuating between fear and extreme fear based on the Fear & Greed Index by CNN.
Yet, the tell-tale signs as shown in the market breadth indicator and the price volume analysis of S&P 500 using the Wyckoff method signal a potential big move ahead as explained in the video at the bottom of this post. Also, according to the seasonality chart of the U.S. midterm elections for the past 72 years, the stock market could be already in the bottoming process, as shown in the comparison chart below.
Using Seasonality Chart as Market Bottom Indicator
Although history doesn’t repeat itself but it often rhymes. That’s why seasonality or cyclical charts are popular as it is invaluable in analysing the stock market. Refer to the seasonality chart by Seasonax below.
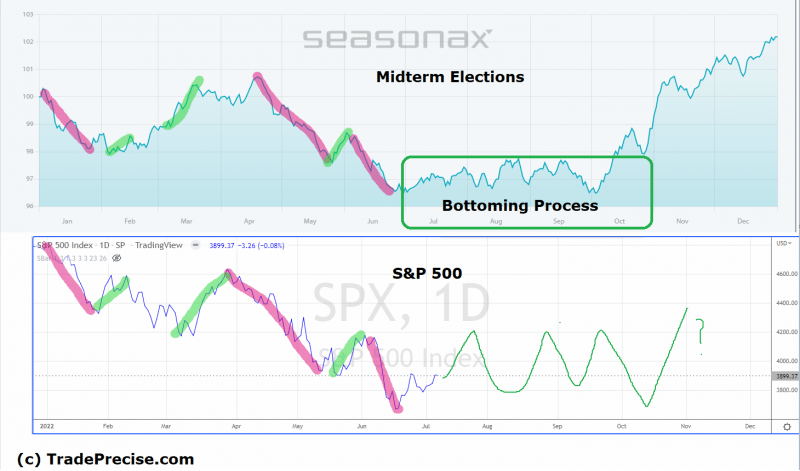
In the first half of 2022, the seasonality chart of the U.S. midterm elections has worked exceptional well in S&P 500, as shown in the comparison chart above where the upper pane is the midterm elections seasonality chart based on the data from the past 72 years while the lower pane is the current price of S&P 500.
The downtrend in January was followed by a technical rally and consolidation in February, which led to a rally in March. The reversal of the uptrend in April marked the worst down move followed by a relief rally in May. Eventually the downtrend resumed in June and created a lower low.
The direction of S&P 500 in each month since this year followed the midterm election seasonality chart closely. Only the magnitude (both to the upside and downside) and the timing were slightly off, such as a lower low (instead of a higher low) was formed in February and March before the strong rally happened. Also, the rally in March did not create a higher high compared to January’s as shown in the seasonality chart.
The low formed in June was followed by 3 months of consolidation in a trading range without creating a lower low, as shown in the first pane of the chart based on the midterm elections seasonality.
The consolidation between June to September is the bottoming process for S&P 500 before a sign of strength rally breaks above the trading range in October, which completes the Wyckoff accumulation structure to start the uptrend.
If the S&P 500 follows the playbook of the midterm elections seasonality chart in the second half of the year, bottoming process is likely unfolding already. A potential trading range between 3650-4200 could last until October 2022, as shown below.

This is significant because while the market is finding its bottom over the next few months, outperforming stocks showing the Wyckoff accumulation characteristics as explained in the video are likely to start moving higher. This is the nature of the leadership stocks, which will lead in the next bull market.
Stock Market Breadth Signals the Next Big Move in S&P 500
As mentioned earlier on, multiple clues from the market breadth indicator and the price volume analysis suggest the next big move in S&P 500. Watch the video below to find out how to spot those characteristics that are likely leading to the next big move in S&P 500.
Combining with the market bottom analysis using the seasonality chart of the U.S. midterm elections, risk-on sentiment could be resumed in the second half of the year. Visit TradePrecise.com to get more stock market insights in email for free.
This article was originally posted on FX Empire
