Stock Market Signal Not Seen Since January
As of the close on Monday, June 17, the S&P 500 Index (SPX) had rallied more than 5% in the course of 10 sessions, powered by trade optimism and talk of a Fed rate cut. The last time the index enjoyed such a quick-and-dirty rally was in early January, but the signals that sounded in 2018 preceded bearish stretches for the SPX in the short term. Below, we take a look at what could be on the horizon for stocks, if history is any indicator.
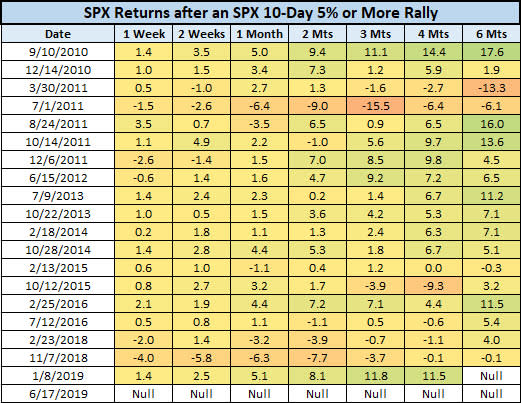
For the study, Schaeffer's Quantitative Analyst Chris Prybal took only one signal every 21 days, to eliminate redundancy. Below are the last 20 signals, which go back to September 2010. As you can see, sharp swings higher in February and November 2018 preceded lackluster price action, especially in the short term. There were no signals in 2017 -- the only year to not see a 10-day SPX rally of at least 5% since 2006.
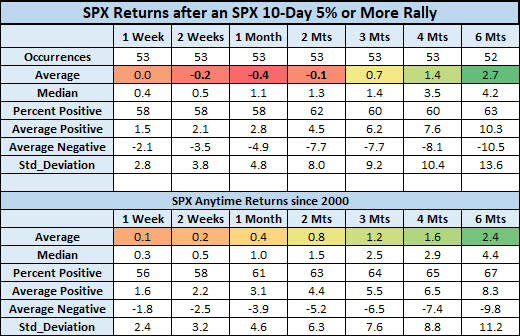
Since 2000, there have been 53 of these signals. Afterwards, the S&P 500 tended to struggle in the short term, averaging losses two weeks, one month, and two months out. That's compared to average anytime gains during those time frames, looking at SPX data since the turn of the millennium. Three months later, the SPX was up just 0.7%, on average, compared to an average anytime gain of 1.2%. In addition, the index was more volatile than usual after quick rallies, as evidenced by the Standard Deviation stats below.
However, much of those post-signal returns were weighed down by extreme selling during the financial crisis. Isolating signals since the March 2009 bottom -- of which there were 28 prior to this week -- and the S&P has performed rather well after these feats of strength.
In these instances, the SPX averaged a two-week gain of 0.4%, and was higher 64.2% of the time. One month out, the index was up 1%, on average -- more than doubling its average anytime gain since 2000. Two, three, and four months later, the SPX was up an impressive 3.1%, 4.1%, and 5.9%, respectively, and was higher 78.6% of the time. Finally, six months after signals since March 2009, the S&P was up an average of 8.9% -- more than three times the norm -- with a win rate of 81.5%.
In the short term, of course, today's Fed decision -- and, more likely, hints of a July rate cut from Fed Chair Jerome Powell -- could determine stock's trajectory. In addition, Wall Street will likely remain reactive to trade headlines, especially with President Donald Trump slated to meet with Chinese President Xi Jinping at next week's G-20 summit.
