Are Strong Financial Prospects The Force That Is Driving The Momentum In Winnebago Industries, Inc.'s NYSE:WGO) Stock?
Winnebago Industries (NYSE:WGO) has had a great run on the share market with its stock up by a significant 33% over the last three months. Since the market usually pay for a company’s long-term fundamentals, we decided to study the company’s key performance indicators to see if they could be influencing the market. Specifically, we decided to study Winnebago Industries' ROE in this article.
Return on equity or ROE is an important factor to be considered by a shareholder because it tells them how effectively their capital is being reinvested. In simpler terms, it measures the profitability of a company in relation to shareholder's equity.
See our latest analysis for Winnebago Industries
How To Calculate Return On Equity?
Return on equity can be calculated by using the formula:
Return on Equity = Net Profit (from continuing operations) ÷ Shareholders' Equity
So, based on the above formula, the ROE for Winnebago Industries is:
12% = US$105m ÷ US$872m (Based on the trailing twelve months to November 2020).
The 'return' is the profit over the last twelve months. One way to conceptualize this is that for each $1 of shareholders' capital it has, the company made $0.12 in profit.
What Has ROE Got To Do With Earnings Growth?
Thus far, we have learned that ROE measures how efficiently a company is generating its profits. Based on how much of its profits the company chooses to reinvest or "retain", we are then able to evaluate a company's future ability to generate profits. Generally speaking, other things being equal, firms with a high return on equity and profit retention, have a higher growth rate than firms that don’t share these attributes.
Winnebago Industries' Earnings Growth And 12% ROE
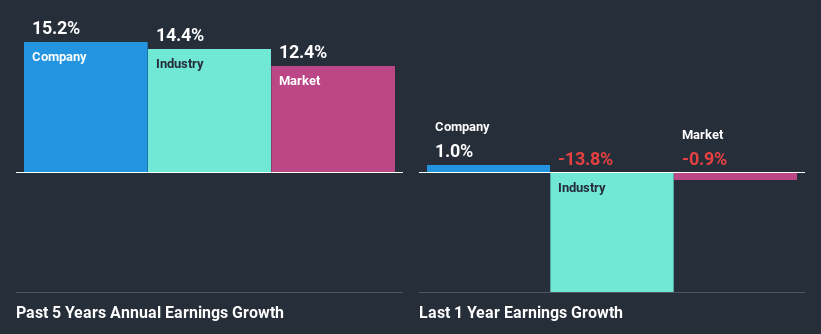
At first glance, Winnebago Industries seems to have a decent ROE. Further, the company's ROE is similar to the industry average of 12%. Consequently, this likely laid the ground for the decent growth of 15% seen over the past five years by Winnebago Industries.
As a next step, we compared Winnebago Industries' net income growth with the industry and found that the company has a similar growth figure when compared with the industry average growth rate of 14% in the same period.
Earnings growth is a huge factor in stock valuation. It’s important for an investor to know whether the market has priced in the company's expected earnings growth (or decline). This then helps them determine if the stock is placed for a bright or bleak future. Is WGO fairly valued? This infographic on the company's intrinsic value has everything you need to know.
Is Winnebago Industries Efficiently Re-investing Its Profits?
Winnebago Industries' three-year median payout ratio to shareholders is 13% (implying that it retains 87% of its income), which is on the lower side, so it seems like the management is reinvesting profits heavily to grow its business.
Besides, Winnebago Industries has been paying dividends over a period of six years. This shows that the company is committed to sharing profits with its shareholders. Upon studying the latest analysts' consensus data, we found that the company's future payout ratio is expected to drop to 8.1% over the next three years.
Conclusion
On the whole, we feel that Winnebago Industries' performance has been quite good. Specifically, we like that the company is reinvesting a huge chunk of its profits at a high rate of return. This of course has caused the company to see substantial growth in its earnings. With that said, the latest industry analyst forecasts reveal that the company's earnings are expected to accelerate. To know more about the latest analysts predictions for the company, check out this visualization of analyst forecasts for the company.
This article by Simply Wall St is general in nature. It does not constitute a recommendation to buy or sell any stock, and does not take account of your objectives, or your financial situation. We aim to bring you long-term focused analysis driven by fundamental data. Note that our analysis may not factor in the latest price-sensitive company announcements or qualitative material. Simply Wall St has no position in any stocks mentioned.
Have feedback on this article? Concerned about the content? Get in touch with us directly. Alternatively, email editorial-team (at) simplywallst.com.

