Is Sunright (SGX:S71) Using Too Much Debt?

Howard Marks put it nicely when he said that, rather than worrying about share price volatility, 'The possibility of permanent loss is the risk I worry about... and every practical investor I know worries about. When we think about how risky a company is, we always like to look at its use of debt, since debt overload can lead to ruin. We can see that Sunright Limited (SGX:S71) does use debt in its business. But the more important question is: how much risk is that debt creating?
Why Does Debt Bring Risk?
Debt is a tool to help businesses grow, but if a business is incapable of paying off its lenders, then it exists at their mercy. In the worst case scenario, a company can go bankrupt if it cannot pay its creditors. However, a more usual (but still expensive) situation is where a company must dilute shareholders at a cheap share price simply to get debt under control. By replacing dilution, though, debt can be an extremely good tool for businesses that need capital to invest in growth at high rates of return. When we think about a company's use of debt, we first look at cash and debt together.
View our latest analysis for Sunright
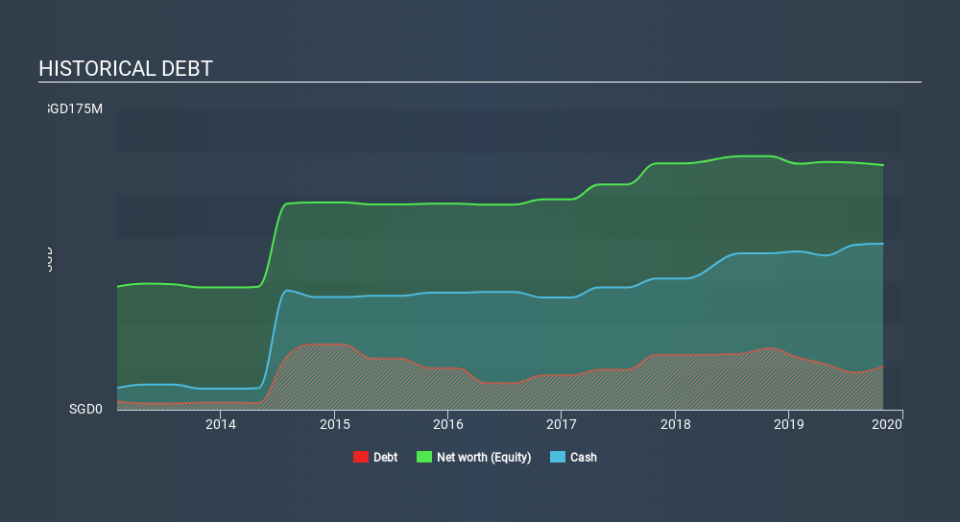
What Is Sunright's Debt?
The image below, which you can click on for greater detail, shows that at October 2019 Sunright had debt of S$22.2m, up from S$35.7 in one year. However, it does have S$96.7m in cash offsetting this, leading to net cash of S$74.5m.
How Healthy Is Sunright's Balance Sheet?
Zooming in on the latest balance sheet data, we can see that Sunright had liabilities of S$34.3m due within 12 months and liabilities of S$11.7m due beyond that. Offsetting these obligations, it had cash of S$96.7m as well as receivables valued at S$25.3m due within 12 months. So it actually has S$76.0m more liquid assets than total liabilities.
This surplus liquidity suggests that Sunright's balance sheet could take a hit just as well as Homer Simpson's head can take a punch. On this basis we think its balance sheet is strong like a sleek panther or even a proud lion. Simply put, the fact that Sunright has more cash than debt is arguably a good indication that it can manage its debt safely.
Importantly, Sunright's EBIT fell a jaw-dropping 83% in the last twelve months. If that decline continues then paying off debt will be harder than selling foie gras at a vegan convention. When analysing debt levels, the balance sheet is the obvious place to start. But it is Sunright's earnings that will influence how the balance sheet holds up in the future. So when considering debt, it's definitely worth looking at the earnings trend. Click here for an interactive snapshot.
But our final consideration is also important, because a company cannot pay debt with paper profits; it needs cold hard cash. Sunright may have net cash on the balance sheet, but it is still interesting to look at how well the business converts its earnings before interest and tax (EBIT) to free cash flow, because that will influence both its need for, and its capacity to manage debt. Over the last three years, Sunright actually produced more free cash flow than EBIT. That sort of strong cash generation warms our hearts like a puppy in a bumblebee suit.
Summing up
While it is always sensible to investigate a company's debt, in this case Sunright has S$74.5m in net cash and a strong balance sheet. And it impressed us with free cash flow of S$21m, being 118% of its EBIT. So we don't think Sunright's use of debt is risky. When analysing debt levels, the balance sheet is the obvious place to start. But ultimately, every company can contain risks that exist outside of the balance sheet. Take risks, for example - Sunright has 3 warning signs (and 1 which makes us a bit uncomfortable) we think you should know about.
Of course, if you're the type of investor who prefers buying stocks without the burden of debt, then don't hesitate to discover our exclusive list of net cash growth stocks, today.
If you spot an error that warrants correction, please contact the editor at editorial-team@simplywallst.com. This article by Simply Wall St is general in nature. It does not constitute a recommendation to buy or sell any stock, and does not take account of your objectives, or your financial situation. Simply Wall St has no position in the stocks mentioned.
We aim to bring you long-term focused research analysis driven by fundamental data. Note that our analysis may not factor in the latest price-sensitive company announcements or qualitative material. Thank you for reading.

