Is Taitron Components Incorporated's (NASDAQ:TAIT) P/E Ratio Really That Good?

Want to participate in a short research study? Help shape the future of investing tools and you could win a $250 gift card!
This article is written for those who want to get better at using price to earnings ratios (P/E ratios). We'll look at Taitron Components Incorporated's (NASDAQ:TAIT) P/E ratio and reflect on what it tells us about the company's share price. What is Taitron Components's P/E ratio? Well, based on the last twelve months it is 11.27. That is equivalent to an earnings yield of about 8.9%.
See our latest analysis for Taitron Components
How Do I Calculate A Price To Earnings Ratio?
The formula for P/E is:
Price to Earnings Ratio = Share Price ÷ Earnings per Share (EPS)
Or for Taitron Components:
P/E of 11.27 = $3.01 ÷ $0.27 (Based on the year to March 2019.)
Is A High Price-to-Earnings Ratio Good?
A higher P/E ratio implies that investors pay a higher price for the earning power of the business. That is not a good or a bad thing per se, but a high P/E does imply buyers are optimistic about the future.
How Growth Rates Impact P/E Ratios
Generally speaking the rate of earnings growth has a profound impact on a company's P/E multiple. When earnings grow, the 'E' increases, over time. That means unless the share price increases, the P/E will reduce in a few years. A lower P/E should indicate the stock is cheap relative to others -- and that may attract buyers.
In the last year, Taitron Components grew EPS like Taylor Swift grew her fan base back in 2010; the 221% gain was both fast and well deserved.
How Does Taitron Components's P/E Ratio Compare To Its Peers?
The P/E ratio indicates whether the market has higher or lower expectations of a company. If you look at the image below, you can see Taitron Components has a lower P/E than the average (17.9) in the electronic industry classification.
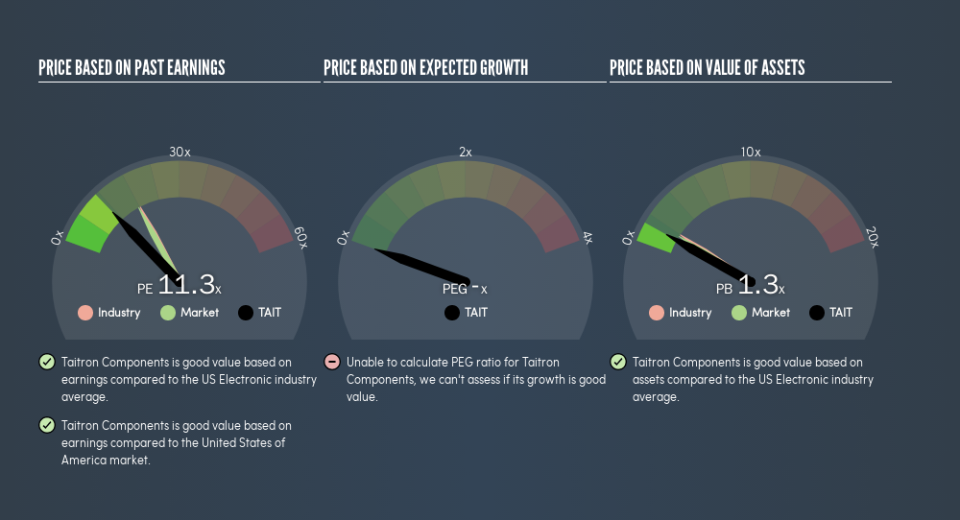
Taitron Components's P/E tells us that market participants think it will not fare as well as its peers in the same industry. Since the market seems unimpressed with Taitron Components, it's quite possible it could surprise on the upside. You should delve deeper. I like to check if company insiders have been buying or selling.
A Limitation: P/E Ratios Ignore Debt and Cash In The Bank
The 'Price' in P/E reflects the market capitalization of the company. That means it doesn't take debt or cash into account. Theoretically, a business can improve its earnings (and produce a lower P/E in the future) by investing in growth. That means taking on debt (or spending its cash).
While growth expenditure doesn't always pay off, the point is that it is a good option to have; but one that the P/E ratio ignores.
Taitron Components's Balance Sheet
Taitron Components has net cash of US$4.5m. This is fairly high at 26% of its market capitalization. That might mean balance sheet strength is important to the business, but should also help push the P/E a bit higher than it would otherwise be.
The Bottom Line On Taitron Components's P/E Ratio
Taitron Components's P/E is 11.3 which is below average (17.6) in the US market. The net cash position gives plenty of options to the business, and the recent improvement in EPS is good to see. The below average P/E ratio suggests that market participants don't believe the strong growth will continue.
When the market is wrong about a stock, it gives savvy investors an opportunity. As value investor Benjamin Graham famously said, 'In the short run, the market is a voting machine but in the long run, it is a weighing machine.' Although we don't have analyst forecasts, you might want to assess this data-rich visualization of earnings, revenue and cash flow.
Of course you might be able to find a better stock than Taitron Components. So you may wish to see this free collection of other companies that have grown earnings strongly.
We aim to bring you long-term focused research analysis driven by fundamental data. Note that our analysis may not factor in the latest price-sensitive company announcements or qualitative material.
If you spot an error that warrants correction, please contact the editor at editorial-team@simplywallst.com. This article by Simply Wall St is general in nature. It does not constitute a recommendation to buy or sell any stock, and does not take account of your objectives, or your financial situation. Simply Wall St has no position in the stocks mentioned. Thank you for reading.
