TAJGVK Hotels & Resorts Limited (NSE:TAJGVK) Earns Among The Best Returns In Its Industry

Want to participate in a short research study? Help shape the future of investing tools and you could win a $250 gift card!
Today we’ll look at TAJGVK Hotels & Resorts Limited (NSE:TAJGVK) and reflect on its potential as an investment. Specifically, we’re going to calculate its Return On Capital Employed (ROCE), in the hopes of getting some insight into the business.
First up, we’ll look at what ROCE is and how we calculate it. Then we’ll compare its ROCE to similar companies. Finally, we’ll look at how its current liabilities affect its ROCE.
Understanding Return On Capital Employed (ROCE)
ROCE measures the amount of pre-tax profits a company can generate from the capital employed in its business. Generally speaking a higher ROCE is better. In brief, it is a useful tool, but it is not without drawbacks. Renowned investment researcher Michael Mauboussin has suggested that a high ROCE can indicate that ‘one dollar invested in the company generates value of more than one dollar’.
So, How Do We Calculate ROCE?
The formula for calculating the return on capital employed is:
Return on Capital Employed = Earnings Before Interest and Tax (EBIT) ÷ (Total Assets – Current Liabilities)
Or for TAJGVK Hotels & Resorts:
0.085 = ₹568m ÷ (₹7.3b – ₹1.1b) (Based on the trailing twelve months to December 2018.)
So, TAJGVK Hotels & Resorts has an ROCE of 8.5%.
See our latest analysis for TAJGVK Hotels & Resorts
Does TAJGVK Hotels & Resorts Have A Good ROCE?
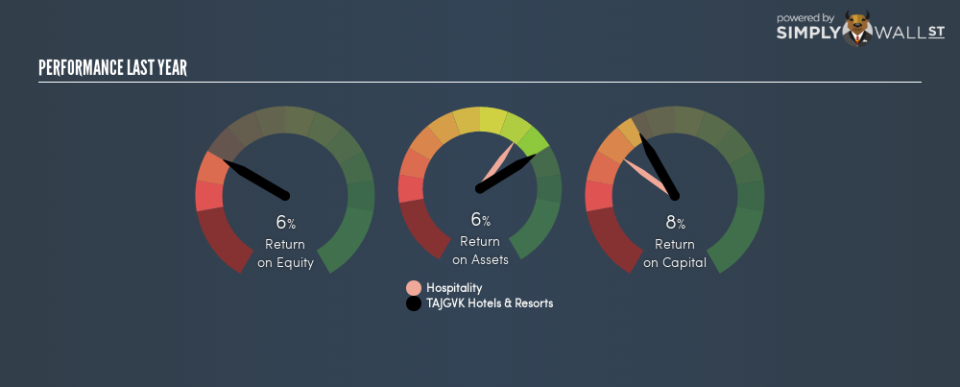
ROCE can be useful when making comparisons, such as between similar companies. Using our data, we find that TAJGVK Hotels & Resorts’s ROCE is meaningfully better than the 7.0% average in the Hospitality industry. We would consider this a positive, as it suggests it is using capital more effectively than other similar companies. Regardless of how TAJGVK Hotels & Resorts stacks up against its industry, its ROCE in absolute terms is quite low (especially compared to a bank account). There are potentially more appealing investments elsewhere.
In our analysis, TAJGVK Hotels & Resorts’s ROCE appears to be 8.5%, compared to 3 years ago, when its ROCE was 5.5%. This makes us think the business might be improving.
It is important to remember that ROCE shows past performance, and is not necessarily predictive. ROCE can be misleading for companies in cyclical industries, with returns looking impressive during the boom times, but very weak during the busts. ROCE is, after all, simply a snap shot of a single year. Since the future is so important for investors, you should check out our free report on analyst forecasts for TAJGVK Hotels & Resorts.
How TAJGVK Hotels & Resorts’s Current Liabilities Impact Its ROCE
Current liabilities are short term bills and invoices that need to be paid in 12 months or less. Due to the way the ROCE equation works, having large bills due in the near term can make it look as though a company has less capital employed, and thus a higher ROCE than usual. To counteract this, we check if a company has high current liabilities, relative to its total assets.
TAJGVK Hotels & Resorts has total liabilities of ₹1.1b and total assets of ₹7.3b. As a result, its current liabilities are equal to approximately 16% of its total assets. With a very reasonable level of current liabilities, so the impact on ROCE is fairly minimal.
The Bottom Line On TAJGVK Hotels & Resorts’s ROCE
That’s not a bad thing, however TAJGVK Hotels & Resorts has a weak ROCE and may not be an attractive investment. Of course you might be able to find a better stock than TAJGVK Hotels & Resorts. So you may wish to see this free collection of other companies that have grown earnings strongly.
I will like TAJGVK Hotels & Resorts better if I see some big insider buys. While we wait, check out this free list of growing companies with considerable, recent, insider buying.
To help readers see past the short term volatility of the financial market, we aim to bring you a long-term focused research analysis purely driven by fundamental data. Note that our analysis does not factor in the latest price-sensitive company announcements.
The author is an independent contributor and at the time of publication had no position in the stocks mentioned. For errors that warrant correction please contact the editor at editorial-team@simplywallst.com.

