Taking A Look At Dr. Reddy’s Laboratories Limited’s (NSE:DRREDDY) ROE

One of the best investments we can make is in our own knowledge and skill set. With that in mind, this article will work through how we can use Return On Equity (ROE) to better understand a business. By way of learning-by-doing, we’ll look at ROE to gain a better understanding of Dr. Reddy’s Laboratories Limited (NSE:DRREDDY).
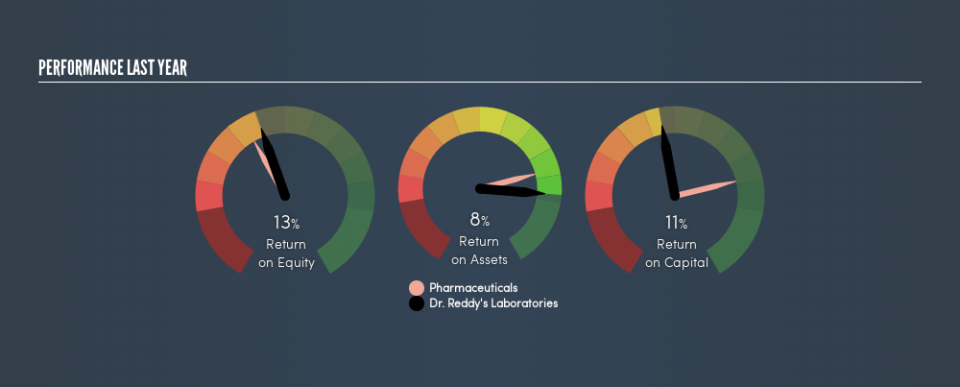
Our data shows Dr. Reddy’s Laboratories has a return on equity of 13% for the last year. One way to conceptualize this, is that for each ₹1 of shareholders’ equity it has, the company made ₹0.13 in profit.
See our latest analysis for Dr. Reddy’s Laboratories
Want to participate in a research study? Help shape the future of investing tools and earn a $60 gift card!
How Do You Calculate Return On Equity?
The formula for return on equity is:
Return on Equity = Net Profit ÷ Shareholders’ Equity
Or for Dr. Reddy’s Laboratories:
13% = ₹17b ÷ ₹136b (Based on the trailing twelve months to December 2018.)
It’s easy to understand the ‘net profit’ part of that equation, but ‘shareholders’ equity’ requires further explanation. It is the capital paid in by shareholders, plus any retained earnings. You can calculate shareholders’ equity by subtracting the company’s total liabilities from its total assets.
What Does Return On Equity Mean?
Return on Equity measures a company’s profitability against the profit it has kept for the business (plus any capital injections). The ‘return’ is the profit over the last twelve months. A higher profit will lead to a higher ROE. So, all else being equal, a high ROE is better than a low one. Clearly, then, one can use ROE to compare different companies.
Does Dr. Reddy’s Laboratories Have A Good Return On Equity?
By comparing a company’s ROE with its industry average, we can get a quick measure of how good it is. However, this method is only useful as a rough check, because companies do differ quite a bit within the same industry classification. You can see in the graphic below that Dr. Reddy’s Laboratories has an ROE that is fairly close to the average for the Pharmaceuticals industry (11%).
That’s neither particularly good, nor bad. ROE doesn’t tell us if the share price is low, but it can inform us to the nature of the business. For those looking for a bargain, other factors may be more important. I will like Dr. Reddy’s Laboratories better if I see some big insider buys. While we wait, check out this free list of growing companies with considerable, recent, insider buying.
The Importance Of Debt To Return On Equity
Companies usually need to invest money to grow their profits. The cash for investment can come from prior year profits (retained earnings), issuing new shares, or borrowing. In the first and second cases, the ROE will reflect this use of cash for investment in the business. In the latter case, the debt used for growth will improve returns, but won’t affect the total equity. That will make the ROE look better than if no debt was used.
Dr. Reddy’s Laboratories’s Debt And Its 13% ROE
Dr. Reddy’s Laboratories has a debt to equity ratio of 0.32, which is far from excessive. I’m not impressed with its ROE, but the debt levels are not too high, indicating the business has decent prospects. Careful use of debt to boost returns is often very good for shareholders. However, it could reduce the company’s ability to take advantage of future opportunities.
The Key Takeaway
Return on equity is one way we can compare the business quality of different companies. In my book the highest quality companies have high return on equity, despite low debt. All else being equal, a higher ROE is better.
But ROE is just one piece of a bigger puzzle, since high quality businesses often trade on high multiples of earnings. The rate at which profits are likely to grow, relative to the expectations of profit growth reflected in the current price, must be considered, too. So I think it may be worth checking this free report on analyst forecasts for the company.
Of course, you might find a fantastic investment by looking elsewhere. So take a peek at this free list of interesting companies.
We aim to bring you long-term focused research analysis driven by fundamental data. Note that our analysis may not factor in the latest price-sensitive company announcements or qualitative material.
If you spot an error that warrants correction, please contact the editor at editorial-team@simplywallst.com. This article by Simply Wall St is general in nature. It does not constitute a recommendation to buy or sell any stock, and does not take account of your objectives, or your financial situation. Simply Wall St has no position in the stocks mentioned. Thank you for reading.
