Taking A Look At Mercury NZ Limited's (NZSE:MCY) ROE

Want to participate in a short research study? Help shape the future of investing tools and you could win a $250 gift card!
Many investors are still learning about the various metrics that can be useful when analysing a stock. This article is for those who would like to learn about Return On Equity (ROE). By way of learning-by-doing, we'll look at ROE to gain a better understanding of Mercury NZ Limited (NZSE:MCY).
Our data shows Mercury NZ has a return on equity of 6.4% for the last year. One way to conceptualize this, is that for each NZ$1 of shareholders' equity it has, the company made NZ$0.064 in profit.
View our latest analysis for Mercury NZ
How Do I Calculate ROE?
The formula for ROE is:
Return on Equity = Net Profit ÷ Shareholders' Equity
Or for Mercury NZ:
6.4% = NZ$207m ÷ NZ$3.2b (Based on the trailing twelve months to December 2018.)
Most know that net profit is the total earnings after all expenses, but the concept of shareholders' equity is a little more complicated. It is all the money paid into the company from shareholders, plus any earnings retained. Shareholders' equity can be calculated by subtracting the total liabilities of the company from the total assets of the company.
What Does Return On Equity Signify?
Return on Equity measures a company's profitability against the profit it has kept for the business (plus any capital injections). The 'return' is the amount earned after tax over the last twelve months. A higher profit will lead to a higher ROE. So, all else being equal, a high ROE is better than a low one. Clearly, then, one can use ROE to compare different companies.
Does Mercury NZ Have A Good Return On Equity?
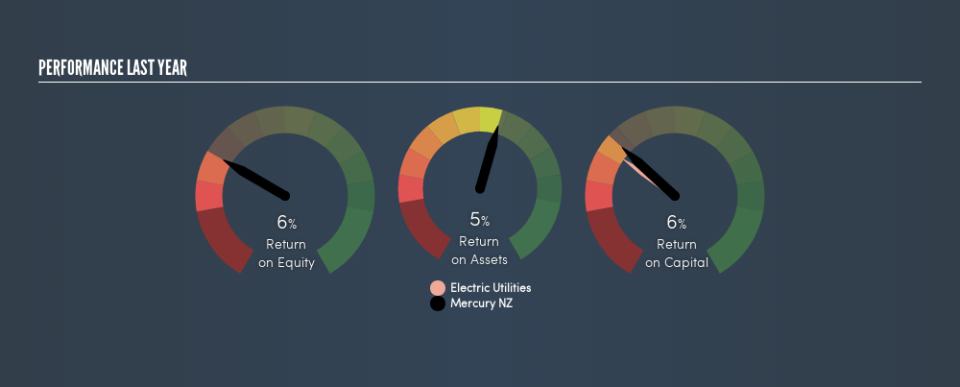
Arguably the easiest way to assess company's ROE is to compare it with the average in its industry. However, this method is only useful as a rough check, because companies do differ quite a bit within the same industry classification. You can see in the graphic below that Mercury NZ has an ROE that is fairly close to the average for the Electric Utilities industry (6.4%).
That's neither particularly good, nor bad. ROE can give us a view about company quality, but many investors also look to other factors, such as whether there are insiders buying shares. For those who like to find winning investments this free list of growing companies with recent insider purchasing, could be just the ticket.
How Does Debt Impact Return On Equity?
Companies usually need to invest money to grow their profits. That cash can come from issuing shares, retained earnings, or debt. In the case of the first and second options, the ROE will reflect this use of cash, for growth. In the latter case, the debt used for growth will improve returns, but won't affect the total equity. That will make the ROE look better than if no debt was used.
Combining Mercury NZ's Debt And Its 6.4% Return On Equity
While Mercury NZ does have some debt, with debt to equity of just 0.44, we wouldn't say debt is excessive. Its ROE isn't particularly impressive, but the debt levels are quite modest, so the business probably has some real potential. Conservative use of debt to boost returns is usually a good move for shareholders, though it does leave the company more exposed to interest rate rises.
In Summary
Return on equity is one way we can compare the business quality of different companies. In my book the highest quality companies have high return on equity, despite low debt. If two companies have the same ROE, then I would generally prefer the one with less debt.
But when a business is high quality, the market often bids it up to a price that reflects this. It is important to consider other factors, such as future profit growth -- and how much investment is required going forward. So you might want to take a peek at this data-rich interactive graph of forecasts for the company.
Of course, you might find a fantastic investment by looking elsewhere. So take a peek at this free list of interesting companies.
We aim to bring you long-term focused research analysis driven by fundamental data. Note that our analysis may not factor in the latest price-sensitive company announcements or qualitative material.
If you spot an error that warrants correction, please contact the editor at editorial-team@simplywallst.com. This article by Simply Wall St is general in nature. It does not constitute a recommendation to buy or sell any stock, and does not take account of your objectives, or your financial situation. Simply Wall St has no position in the stocks mentioned. Thank you for reading.

