Techstep (OB:TECH) Has A Rock Solid Balance Sheet

Legendary fund manager Li Lu (who Charlie Munger backed) once said, 'The biggest investment risk is not the volatility of prices, but whether you will suffer a permanent loss of capital. So it might be obvious that you need to consider debt, when you think about how risky any given stock is, because too much debt can sink a company. As with many other companies Techstep ASA (OB:TECH) makes use of debt. But the real question is whether this debt is making the company risky.
Why Does Debt Bring Risk?
Debt assists a business until the business has trouble paying it off, either with new capital or with free cash flow. If things get really bad, the lenders can take control of the business. While that is not too common, we often do see indebted companies permanently diluting shareholders because lenders force them to raise capital at a distressed price. By replacing dilution, though, debt can be an extremely good tool for businesses that need capital to invest in growth at high rates of return. The first thing to do when considering how much debt a business uses is to look at its cash and debt together.
View our latest analysis for Techstep
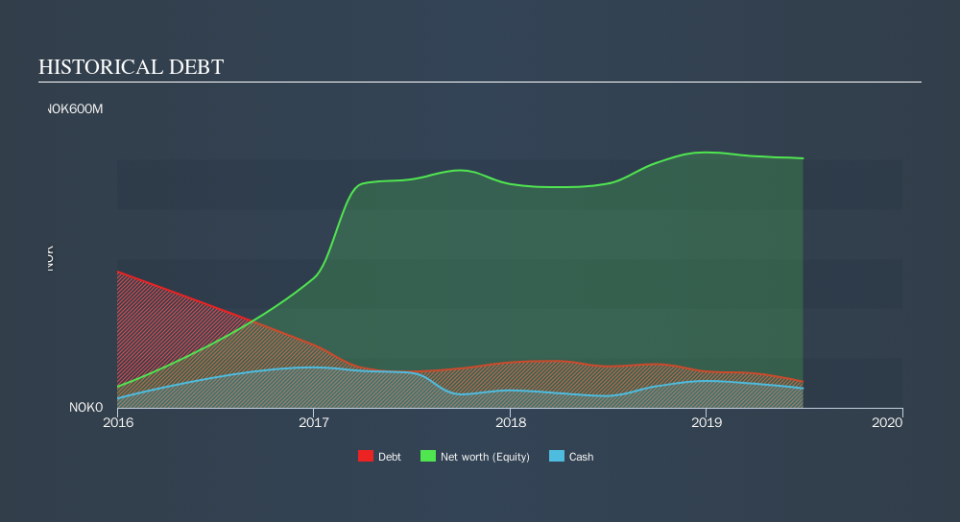
What Is Techstep's Net Debt?
The image below, which you can click on for greater detail, shows that Techstep had debt of kr52.8m at the end of June 2019, a reduction from kr83.4m over a year. However, because it has a cash reserve of kr39.2m, its net debt is less, at about kr13.6m.
A Look At Techstep's Liabilities
According to the last reported balance sheet, Techstep had liabilities of kr250.8m due within 12 months, and liabilities of kr49.5m due beyond 12 months. Offsetting these obligations, it had cash of kr39.2m as well as receivables valued at kr171.9m due within 12 months. So its liabilities outweigh the sum of its cash and (near-term) receivables by kr89.3m.
Since publicly traded Techstep shares are worth a total of kr540.8m, it seems unlikely that this level of liabilities would be a major threat. Having said that, it's clear that we should continue to monitor its balance sheet, lest it change for the worse.
In order to size up a company's debt relative to its earnings, we calculate its net debt divided by its earnings before interest, tax, depreciation, and amortization (EBITDA) and its earnings before interest and tax (EBIT) divided by its interest expense (its interest cover). The advantage of this approach is that we take into account both the absolute quantum of debt (with net debt to EBITDA) and the actual interest expenses associated with that debt (with its interest cover ratio).
Techstep has a low debt to EBITDA ratio of only 0.43. And remarkably, despite having net debt, it actually received more in interest over the last twelve months than it had to pay. So there's no doubt this company can take on debt while staying cool as a cucumber. On top of that, Techstep grew its EBIT by 87% over the last twelve months, and that growth will make it easier to handle its debt. There's no doubt that we learn most about debt from the balance sheet. But it is Techstep's earnings that will influence how the balance sheet holds up in the future. So if you're keen to discover more about its earnings, it might be worth checking out this graph of its long term earnings trend.
Finally, while the tax-man may adore accounting profits, lenders only accept cold hard cash. So it's worth checking how much of that EBIT is backed by free cash flow. During the last two years, Techstep produced sturdy free cash flow equating to 67% of its EBIT, about what we'd expect. This free cash flow puts the company in a good position to pay down debt, when appropriate.
Our View
The good news is that Techstep's demonstrated ability to cover its interest expense with its EBIT delights us like a fluffy puppy does a toddler. And that's just the beginning of the good news since its EBIT growth rate is also very heartening. Overall, we don't think Techstep is taking any bad risks, as its debt load seems modest. So we're not worried about the use of a little leverage on the balance sheet. Over time, share prices tend to follow earnings per share, so if you're interested in Techstep, you may well want to click here to check an interactive graph of its earnings per share history.
Of course, if you're the type of investor who prefers buying stocks without the burden of debt, then don't hesitate to discover our exclusive list of net cash growth stocks, today.
We aim to bring you long-term focused research analysis driven by fundamental data. Note that our analysis may not factor in the latest price-sensitive company announcements or qualitative material.
If you spot an error that warrants correction, please contact the editor at editorial-team@simplywallst.com. This article by Simply Wall St is general in nature. It does not constitute a recommendation to buy or sell any stock, and does not take account of your objectives, or your financial situation. Simply Wall St has no position in the stocks mentioned. Thank you for reading.
