Is Telia Company AB (publ)'s (STO:TELIA) P/E Ratio Really That Good?

The goal of this article is to teach you how to use price to earnings ratios (P/E ratios). We'll look at Telia Company AB (publ)'s (STO:TELIA) P/E ratio and reflect on what it tells us about the company's share price. Telia Company has a price to earnings ratio of 22.06, based on the last twelve months. That corresponds to an earnings yield of approximately 4.5%.
Check out our latest analysis for Telia Company
How Do I Calculate Telia Company's Price To Earnings Ratio?
The formula for P/E is:
Price to Earnings Ratio = Price per Share ÷ Earnings per Share (EPS)
Or for Telia Company:
P/E of 22.06 = SEK39.30 ÷ SEK1.78 (Based on the trailing twelve months to December 2019.)
Is A High Price-to-Earnings Ratio Good?
A higher P/E ratio means that buyers have to pay a higher price for each SEK1 the company has earned over the last year. That is not a good or a bad thing per se, but a high P/E does imply buyers are optimistic about the future.
How Does Telia Company's P/E Ratio Compare To Its Peers?
The P/E ratio indicates whether the market has higher or lower expectations of a company. If you look at the image below, you can see Telia Company has a lower P/E than the average (24.3) in the telecom industry classification.
This suggests that market participants think Telia Company will underperform other companies in its industry. While current expectations are low, the stock could be undervalued if the situation is better than the market assumes. You should delve deeper. I like to check if company insiders have been buying or selling.
How Growth Rates Impact P/E Ratios
If earnings fall then in the future the 'E' will be lower. That means unless the share price falls, the P/E will increase in a few years. A higher P/E should indicate the stock is expensive relative to others -- and that may encourage shareholders to sell.
Telia Company saw earnings per share decrease by 20% last year. And over the longer term (5 years) earnings per share have decreased 7.1% annually. This growth rate might warrant a below average P/E ratio.
Remember: P/E Ratios Don't Consider The Balance Sheet
It's important to note that the P/E ratio considers the market capitalization, not the enterprise value. So it won't reflect the advantage of cash, or disadvantage of debt. Theoretically, a business can improve its earnings (and produce a lower P/E in the future) by investing in growth. That means taking on debt (or spending its cash).
Such expenditure might be good or bad, in the long term, but the point here is that the balance sheet is not reflected by this ratio.
How Does Telia Company's Debt Impact Its P/E Ratio?
Net debt totals 60% of Telia Company's market cap. This is enough debt that you'd have to make some adjustments before using the P/E ratio to compare it to a company with net cash.
The Bottom Line On Telia Company's P/E Ratio
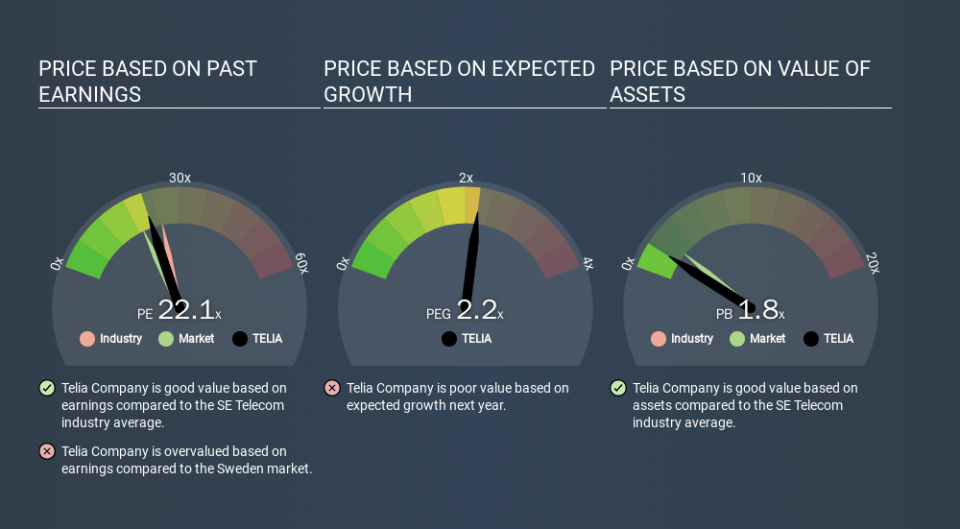
Telia Company trades on a P/E ratio of 22.1, which is above its market average of 18.6. With significant debt and no EPS growth last year, shareholders are betting on an improvement in earnings from the company.
When the market is wrong about a stock, it gives savvy investors an opportunity. People often underestimate remarkable growth -- so investors can make money when fast growth is not fully appreciated. So this free visual report on analyst forecasts could hold the key to an excellent investment decision.
Of course you might be able to find a better stock than Telia Company. So you may wish to see this free collection of other companies that have grown earnings strongly.
If you spot an error that warrants correction, please contact the editor at editorial-team@simplywallst.com. This article by Simply Wall St is general in nature. It does not constitute a recommendation to buy or sell any stock, and does not take account of your objectives, or your financial situation. Simply Wall St has no position in the stocks mentioned.
We aim to bring you long-term focused research analysis driven by fundamental data. Note that our analysis may not factor in the latest price-sensitive company announcements or qualitative material. Thank you for reading.
