Should You Be Tempted To Sell Ackermans & Van Haaren NV (EBR:ACKB) Because Of Its P/E Ratio?

Want to participate in a short research study? Help shape the future of investing tools and receive a $20 prize!
This article is for investors who would like to improve their understanding of price to earnings ratios (P/E ratios). To keep it practical, we’ll show how Ackermans & Van Haaren NV’s (EBR:ACKB) P/E ratio could help you assess the value on offer. Ackermans & Van Haaren has a price to earnings ratio of 16.7, based on the last twelve months. That is equivalent to an earnings yield of about 6.0%.
Check out our latest analysis for Ackermans & Van Haaren
How Do I Calculate A Price To Earnings Ratio?
The formula for P/E is:
Price to Earnings Ratio = Share Price ÷ Earnings per Share (EPS)
Or for Ackermans & Van Haaren:
P/E of 16.7 = €141.5 ÷ €8.47 (Based on the trailing twelve months to June 2018.)
Is A High Price-to-Earnings Ratio Good?
A higher P/E ratio implies that investors pay a higher price for the earning power of the business. That isn’t necessarily good or bad, but a high P/E implies relatively high expectations of what a company can achieve in the future.
How Growth Rates Impact P/E Ratios
P/E ratios primarily reflect market expectations around earnings growth rates. That’s because companies that grow earnings per share quickly will rapidly increase the ‘E’ in the equation. That means unless the share price increases, the P/E will reduce in a few years. A lower P/E should indicate the stock is cheap relative to others — and that may attract buyers.
Ackermans & Van Haaren saw earnings per share improve by -2.8% last year. And earnings per share have improved by 1.9% annually, over the last five years.
How Does Ackermans & Van Haaren’s P/E Ratio Compare To Its Peers?
We can get an indication of market expectations by looking at the P/E ratio. The image below shows that Ackermans & Van Haaren has a higher P/E than the average (15) P/E for companies in the diversified financial industry.
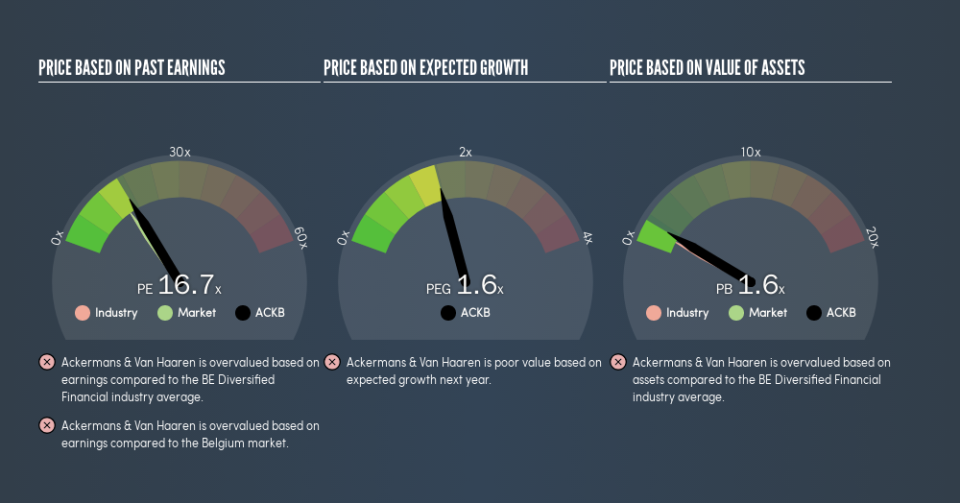
Its relatively high P/E ratio indicates that Ackermans & Van Haaren shareholders think it will perform better than other companies in its industry classification. Clearly the market expects growth, but it isn’t guaranteed. So investors should delve deeper. I like to check if company insiders have been buying or selling.
Remember: P/E Ratios Don’t Consider The Balance Sheet
The ‘Price’ in P/E reflects the market capitalization of the company. In other words, it does not consider any debt or cash that the company may have on the balance sheet. Hypothetically, a company could reduce its future P/E ratio by spending its cash (or taking on debt) to achieve higher earnings.
Such expenditure might be good or bad, in the long term, but the point here is that the balance sheet is not reflected by this ratio.
Is Debt Impacting Ackermans & Van Haaren’s P/E?
Ackermans & Van Haaren’s net debt is 29% of its market cap. This is enough debt that you’d have to make some adjustments before using the P/E ratio to compare it to a company with net cash.
The Bottom Line On Ackermans & Van Haaren’s P/E Ratio
Ackermans & Van Haaren’s P/E is 16.7 which is above average (15) in the BE market. With debt at prudent levels and improving earnings, it’s fair to say the market expects steady progress in the future.
Investors should be looking to buy stocks that the market is wrong about. People often underestimate remarkable growth — so investors can make money when fast growth is not fully appreciated. So this free visualization of the analyst consensus on future earnings could help you make the right decision about whether to buy, sell, or hold.
You might be able to find a better buy than Ackermans & Van Haaren. If you want a selection of possible winners, check out this free list of interesting companies that trade on a P/E below 20 (but have proven they can grow earnings).
We aim to bring you long-term focused research analysis driven by fundamental data. Note that our analysis may not factor in the latest price-sensitive company announcements or qualitative material.
If you spot an error that warrants correction, please contact the editor at editorial-team@simplywallst.com. This article by Simply Wall St is general in nature. It does not constitute a recommendation to buy or sell any stock, and does not take account of your objectives, or your financial situation. Simply Wall St has no position in the stocks mentioned. Thank you for reading.
