Should You Be Tempted To Sell Aeorema Communications plc (LON:AEO) Because Of Its P/E Ratio?

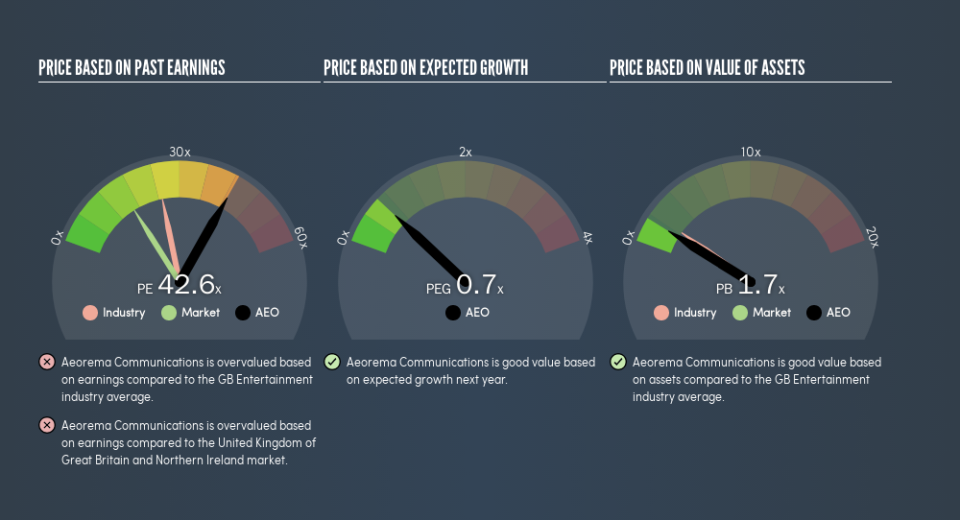
The goal of this article is to teach you how to use price to earnings ratios (P/E ratios). We'll apply a basic P/E ratio analysis to Aeorema Communications plc's (LON:AEO), to help you decide if the stock is worth further research. Aeorema Communications has a P/E ratio of 42.63, based on the last twelve months. That corresponds to an earnings yield of approximately 2.3%.
Want to participate in a short research study? Help shape the future of investing tools and you could win a $250 gift card!
Check out our latest analysis for Aeorema Communications
How Do I Calculate A Price To Earnings Ratio?
The formula for P/E is:
Price to Earnings Ratio = Price per Share ÷ Earnings per Share (EPS)
Or for Aeorema Communications:
P/E of 42.63 = £0.28 ÷ £0.0066 (Based on the trailing twelve months to December 2018.)
Is A High P/E Ratio Good?
The higher the P/E ratio, the higher the price tag of a business, relative to its trailing earnings. That isn't necessarily good or bad, but a high P/E implies relatively high expectations of what a company can achieve in the future.
How Growth Rates Impact P/E Ratios
Companies that shrink earnings per share quickly will rapidly decrease the 'E' in the equation. That means even if the current P/E is low, it will increase over time if the share price stays flat. So while a stock may look cheap based on past earnings, it could be expensive based on future earnings.
Aeorema Communications's earnings made like a rocket, taking off 67% last year. On the other hand, the longer term performance is poor, with EPS down 32% per year over 5 years.
How Does Aeorema Communications's P/E Ratio Compare To Its Peers?
The P/E ratio indicates whether the market has higher or lower expectations of a company. As you can see below, Aeorema Communications has a higher P/E than the average company (25) in the entertainment industry.
That means that the market expects Aeorema Communications will outperform other companies in its industry. Shareholders are clearly optimistic, but the future is always uncertain. So investors should always consider the P/E ratio alongside other factors, such as whether company directors have been buying shares.
Don't Forget: The P/E Does Not Account For Debt or Bank Deposits
Don't forget that the P/E ratio considers market capitalization. Thus, the metric does not reflect cash or debt held by the company. The exact same company would hypothetically deserve a higher P/E ratio if it had a strong balance sheet, than if it had a weak one with lots of debt, because a cashed up company can spend on growth.
Such expenditure might be good or bad, in the long term, but the point here is that the balance sheet is not reflected by this ratio.
Is Debt Impacting Aeorema Communications's P/E?
With net cash of UK£1.0m, Aeorema Communications has a very strong balance sheet, which may be important for its business. Having said that, at 41% of its market capitalization the cash hoard would contribute towards a higher P/E ratio.
The Bottom Line On Aeorema Communications's P/E Ratio
Aeorema Communications trades on a P/E ratio of 42.6, which is above the GB market average of 16.2. The excess cash it carries is the gravy on top its fast EPS growth. So based on this analysis we'd expect Aeorema Communications to have a high P/E ratio.
When the market is wrong about a stock, it gives savvy investors an opportunity. People often underestimate remarkable growth -- so investors can make money when fast growth is not fully appreciated. So this free report on the analyst consensus forecasts could help you make a master move on this stock.
Of course you might be able to find a better stock than Aeorema Communications. So you may wish to see this free collection of other companies that have grown earnings strongly.
We aim to bring you long-term focused research analysis driven by fundamental data. Note that our analysis may not factor in the latest price-sensitive company announcements or qualitative material.
If you spot an error that warrants correction, please contact the editor at editorial-team@simplywallst.com. This article by Simply Wall St is general in nature. It does not constitute a recommendation to buy or sell any stock, and does not take account of your objectives, or your financial situation. Simply Wall St has no position in the stocks mentioned. Thank you for reading.
