Should You Be Tempted To Sell Amrutanjan Health Care Limited (NSE:AMRUTANJAN) Because Of Its P/E Ratio?

Want to participate in a short research study? Help shape the future of investing tools and you could win a $250 gift card!
Today, we'll introduce the concept of the P/E ratio for those who are learning about investing. To keep it practical, we'll show how Amrutanjan Health Care Limited's (NSE:AMRUTANJAN) P/E ratio could help you assess the value on offer. What is Amrutanjan Health Care's P/E ratio? Well, based on the last twelve months it is 36.53. That is equivalent to an earnings yield of about 2.7%.
See our latest analysis for Amrutanjan Health Care
How Do I Calculate A Price To Earnings Ratio?
The formula for price to earnings is:
Price to Earnings Ratio = Price per Share ÷ Earnings per Share (EPS)
Or for Amrutanjan Health Care:
P/E of 36.53 = ₹312.5 ÷ ₹8.56 (Based on the trailing twelve months to March 2019.)
Is A High Price-to-Earnings Ratio Good?
A higher P/E ratio means that buyers have to pay a higher price for each ₹1 the company has earned over the last year. That isn't necessarily good or bad, but a high P/E implies relatively high expectations of what a company can achieve in the future.
How Growth Rates Impact P/E Ratios
P/E ratios primarily reflect market expectations around earnings growth rates. Earnings growth means that in the future the 'E' will be higher. That means even if the current P/E is high, it will reduce over time if the share price stays flat. A lower P/E should indicate the stock is cheap relative to others -- and that may attract buyers.
It's great to see that Amrutanjan Health Care grew EPS by 25% in the last year. And it has bolstered its earnings per share by 15% per year over the last five years. This could arguably justify a relatively high P/E ratio.
How Does Amrutanjan Health Care's P/E Ratio Compare To Its Peers?
We can get an indication of market expectations by looking at the P/E ratio. You can see in the image below that the average P/E (18.1) for companies in the pharmaceuticals industry is lower than Amrutanjan Health Care's P/E.
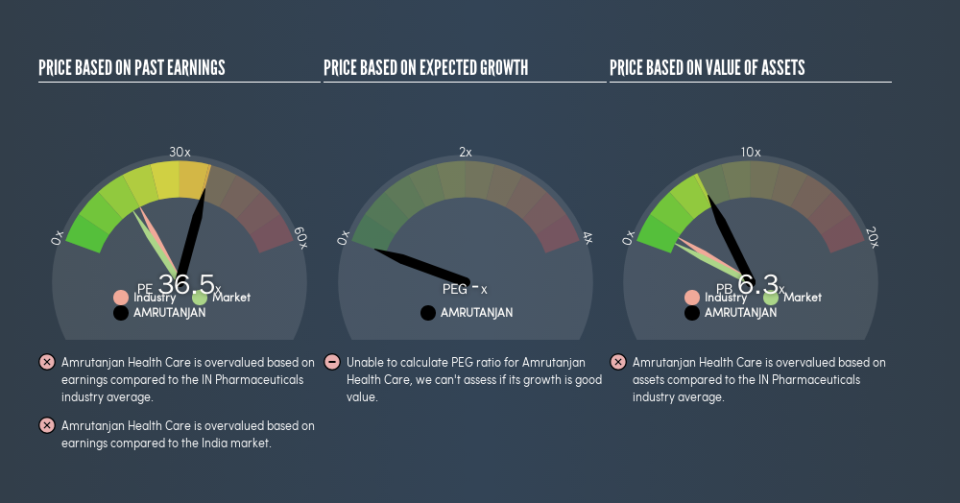
Amrutanjan Health Care's P/E tells us that market participants think the company will perform better than its industry peers, going forward. Clearly the market expects growth, but it isn't guaranteed. So investors should delve deeper. I like to check if company insiders have been buying or selling.
Don't Forget: The P/E Does Not Account For Debt or Bank Deposits
The 'Price' in P/E reflects the market capitalization of the company. Thus, the metric does not reflect cash or debt held by the company. The exact same company would hypothetically deserve a higher P/E ratio if it had a strong balance sheet, than if it had a weak one with lots of debt, because a cashed up company can spend on growth.
Such expenditure might be good or bad, in the long term, but the point here is that the balance sheet is not reflected by this ratio.
So What Does Amrutanjan Health Care's Balance Sheet Tell Us?
Amrutanjan Health Care has net cash of ₹862m. That should lead to a higher P/E than if it did have debt, because its strong balance sheets gives it more options.
The Bottom Line On Amrutanjan Health Care's P/E Ratio
Amrutanjan Health Care trades on a P/E ratio of 36.5, which is above the IN market average of 15.8. With cash in the bank the company has plenty of growth options -- and it is already on the right track. So it is not surprising the market is probably extrapolating recent growth well into the future, reflected in the relatively high P/E ratio.
Investors have an opportunity when market expectations about a stock are wrong. As value investor Benjamin Graham famously said, 'In the short run, the market is a voting machine but in the long run, it is a weighing machine.' Although we don't have analyst forecasts, you could get a better understanding of its growth by checking out this more detailed historical graph of earnings, revenue and cash flow.
Of course, you might find a fantastic investment by looking at a few good candidates. So take a peek at this free list of companies with modest (or no) debt, trading on a P/E below 20.
We aim to bring you long-term focused research analysis driven by fundamental data. Note that our analysis may not factor in the latest price-sensitive company announcements or qualitative material.
If you spot an error that warrants correction, please contact the editor at editorial-team@simplywallst.com. This article by Simply Wall St is general in nature. It does not constitute a recommendation to buy or sell any stock, and does not take account of your objectives, or your financial situation. Simply Wall St has no position in the stocks mentioned. Thank you for reading.

