Should You Be Tempted To Sell Dafy Holdings Limited (HKG:1826) Because Of Its P/E Ratio?

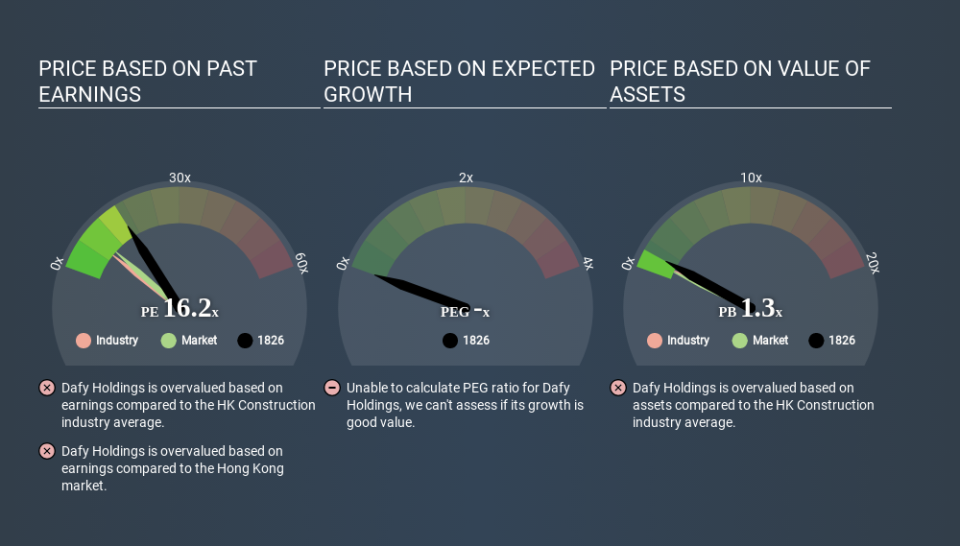
The goal of this article is to teach you how to use price to earnings ratios (P/E ratios). We'll show how you can use Dafy Holdings Limited's (HKG:1826) P/E ratio to inform your assessment of the investment opportunity. Based on the last twelve months, Dafy Holdings's P/E ratio is 16.18. That corresponds to an earnings yield of approximately 6.2%.
See our latest analysis for Dafy Holdings
How Do I Calculate A Price To Earnings Ratio?
The formula for P/E is:
Price to Earnings Ratio = Price per Share ÷ Earnings per Share (EPS)
Or for Dafy Holdings:
P/E of 16.18 = HK$0.275 ÷ HK$0.017 (Based on the year to December 2019.)
(Note: the above calculation results may not be precise due to rounding.)
Is A High Price-to-Earnings Ratio Good?
A higher P/E ratio implies that investors pay a higher price for the earning power of the business. That isn't necessarily good or bad, but a high P/E implies relatively high expectations of what a company can achieve in the future.
Does Dafy Holdings Have A Relatively High Or Low P/E For Its Industry?
One good way to get a quick read on what market participants expect of a company is to look at its P/E ratio. As you can see below, Dafy Holdings has a higher P/E than the average company (7.9) in the construction industry.
That means that the market expects Dafy Holdings will outperform other companies in its industry. Shareholders are clearly optimistic, but the future is always uncertain. So further research is always essential. I often monitor director buying and selling.
How Growth Rates Impact P/E Ratios
When earnings fall, the 'E' decreases, over time. That means unless the share price falls, the P/E will increase in a few years. So while a stock may look cheap based on past earnings, it could be expensive based on future earnings.
Dafy Holdings saw earnings per share decrease by 35% last year. And it has shrunk its earnings per share by 12% per year over the last three years. This could justify a low P/E.
Remember: P/E Ratios Don't Consider The Balance Sheet
One drawback of using a P/E ratio is that it considers market capitalization, but not the balance sheet. So it won't reflect the advantage of cash, or disadvantage of debt. Theoretically, a business can improve its earnings (and produce a lower P/E in the future) by investing in growth. That means taking on debt (or spending its cash).
While growth expenditure doesn't always pay off, the point is that it is a good option to have; but one that the P/E ratio ignores.
Dafy Holdings's Balance Sheet
With net cash of HK$128m, Dafy Holdings has a very strong balance sheet, which may be important for its business. Having said that, at 35% of its market capitalization the cash hoard would contribute towards a higher P/E ratio.
The Verdict On Dafy Holdings's P/E Ratio
Dafy Holdings's P/E is 16.2 which is above average (9.2) in its market. The recent drop in earnings per share might keep value investors away, but the net cash position means the company has time to improve: and the high P/E suggests the market thinks it will.
When the market is wrong about a stock, it gives savvy investors an opportunity. As value investor Benjamin Graham famously said, 'In the short run, the market is a voting machine but in the long run, it is a weighing machine. Although we don't have analyst forecasts you could get a better understanding of its growth by checking out this more detailed historical graph of earnings, revenue and cash flow.
Of course you might be able to find a better stock than Dafy Holdings. So you may wish to see this free collection of other companies that have grown earnings strongly.
If you spot an error that warrants correction, please contact the editor at editorial-team@simplywallst.com. This article by Simply Wall St is general in nature. It does not constitute a recommendation to buy or sell any stock, and does not take account of your objectives, or your financial situation. Simply Wall St has no position in the stocks mentioned.
We aim to bring you long-term focused research analysis driven by fundamental data. Note that our analysis may not factor in the latest price-sensitive company announcements or qualitative material. Thank you for reading.
