Should You Be Tempted To Sell Gamma Communications plc (LON:GAMA) Because Of Its P/E Ratio?

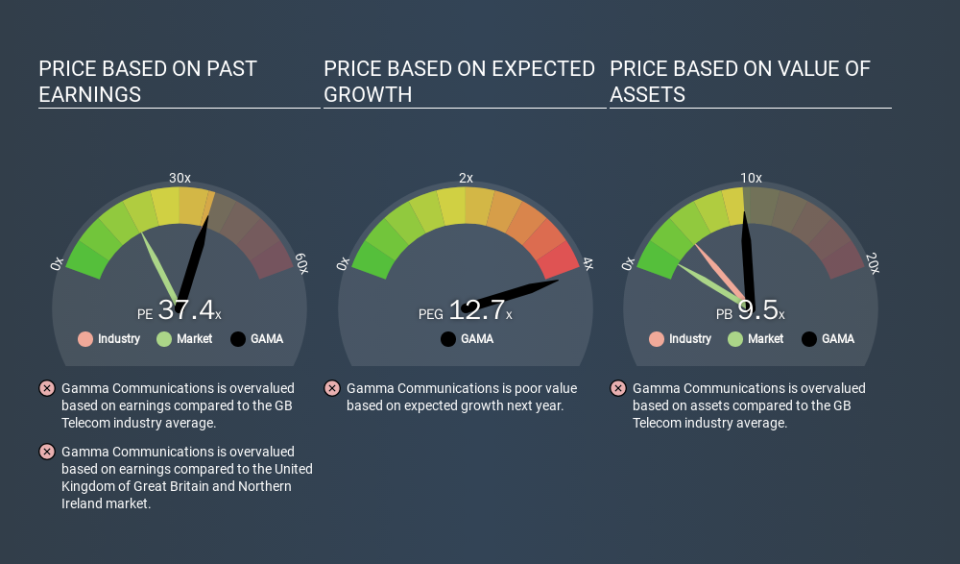
The goal of this article is to teach you how to use price to earnings ratios (P/E ratios). We'll look at Gamma Communications plc's (LON:GAMA) P/E ratio and reflect on what it tells us about the company's share price. Looking at earnings over the last twelve months, Gamma Communications has a P/E ratio of 37.37. That means that at current prices, buyers pay £37.37 for every £1 in trailing yearly profits.
Check out our latest analysis for Gamma Communications
How Do You Calculate A P/E Ratio?
The formula for price to earnings is:
Price to Earnings Ratio = Price per Share ÷ Earnings per Share (EPS)
Or for Gamma Communications:
P/E of 37.37 = GBP13.60 ÷ GBP0.36 (Based on the year to June 2019.)
Is A High Price-to-Earnings Ratio Good?
A higher P/E ratio implies that investors pay a higher price for the earning power of the business. That is not a good or a bad thing per se, but a high P/E does imply buyers are optimistic about the future.
Does Gamma Communications Have A Relatively High Or Low P/E For Its Industry?
One good way to get a quick read on what market participants expect of a company is to look at its P/E ratio. As you can see below Gamma Communications has a P/E ratio that is fairly close for the average for the telecom industry, which is 36.4.
Its P/E ratio suggests that Gamma Communications shareholders think that in the future it will perform about the same as other companies in its industry classification. If the company has better than average prospects, then the market might be underestimating it. I would further inform my view by checking insider buying and selling., among other things.
How Growth Rates Impact P/E Ratios
Probably the most important factor in determining what P/E a company trades on is the earnings growth. That's because companies that grow earnings per share quickly will rapidly increase the 'E' in the equation. Therefore, even if you pay a high multiple of earnings now, that multiple will become lower in the future. So while a stock may look expensive based on past earnings, it could be cheap based on future earnings.
Gamma Communications increased earnings per share by a whopping 37% last year. And its annual EPS growth rate over 5 years is 25%. So we'd generally expect it to have a relatively high P/E ratio.
Don't Forget: The P/E Does Not Account For Debt or Bank Deposits
Don't forget that the P/E ratio considers market capitalization. So it won't reflect the advantage of cash, or disadvantage of debt. The exact same company would hypothetically deserve a higher P/E ratio if it had a strong balance sheet, than if it had a weak one with lots of debt, because a cashed up company can spend on growth.
Such spending might be good or bad, overall, but the key point here is that you need to look at debt to understand the P/E ratio in context.
How Does Gamma Communications's Debt Impact Its P/E Ratio?
Since Gamma Communications holds net cash of UK£45m, it can spend on growth, justifying a higher P/E ratio than otherwise.
The Verdict On Gamma Communications's P/E Ratio
Gamma Communications's P/E is 37.4 which is above average (18.8) in its market. Its net cash position is the cherry on top of its superb EPS growth. So based on this analysis we'd expect Gamma Communications to have a high P/E ratio.
Investors should be looking to buy stocks that the market is wrong about. As value investor Benjamin Graham famously said, 'In the short run, the market is a voting machine but in the long run, it is a weighing machine. So this free visualization of the analyst consensus on future earnings could help you make the right decision about whether to buy, sell, or hold.
But note: Gamma Communications may not be the best stock to buy. So take a peek at this free list of interesting companies with strong recent earnings growth (and a P/E ratio below 20).
If you spot an error that warrants correction, please contact the editor at editorial-team@simplywallst.com. This article by Simply Wall St is general in nature. It does not constitute a recommendation to buy or sell any stock, and does not take account of your objectives, or your financial situation. Simply Wall St has no position in the stocks mentioned.
We aim to bring you long-term focused research analysis driven by fundamental data. Note that our analysis may not factor in the latest price-sensitive company announcements or qualitative material. Thank you for reading.
