Should You Be Tempted To Sell Honda Siel Power Products Limited (NSE:HONDAPOWER) Because Of Its P/E Ratio?

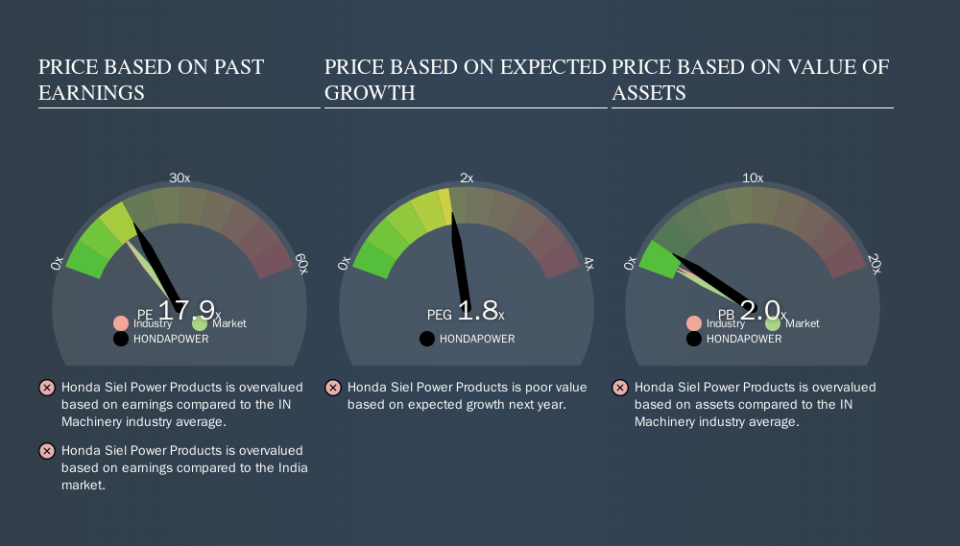
This article is for investors who would like to improve their understanding of price to earnings ratios (P/E ratios). We'll look at Honda Siel Power Products Limited's (NSE:HONDAPOWER) P/E ratio and reflect on what it tells us about the company's share price. Honda Siel Power Products has a price to earnings ratio of 17.88, based on the last twelve months. That means that at current prices, buyers pay ₹17.88 for every ₹1 in trailing yearly profits.
Check out our latest analysis for Honda Siel Power Products
How Do I Calculate Honda Siel Power Products's Price To Earnings Ratio?
The formula for P/E is:
Price to Earnings Ratio = Price per Share ÷ Earnings per Share (EPS)
Or for Honda Siel Power Products:
P/E of 17.88 = ₹1034.85 ÷ ₹57.87 (Based on the trailing twelve months to June 2019.)
Is A High Price-to-Earnings Ratio Good?
A higher P/E ratio implies that investors pay a higher price for the earning power of the business. That isn't a good or a bad thing on its own, but a high P/E means that buyers have a higher opinion of the business's prospects, relative to stocks with a lower P/E.
Does Honda Siel Power Products Have A Relatively High Or Low P/E For Its Industry?
One good way to get a quick read on what market participants expect of a company is to look at its P/E ratio. As you can see below, Honda Siel Power Products has a higher P/E than the average company (13.4) in the machinery industry.
That means that the market expects Honda Siel Power Products will outperform other companies in its industry. The market is optimistic about the future, but that doesn't guarantee future growth. So investors should delve deeper. I like to check if company insiders have been buying or selling.
How Growth Rates Impact P/E Ratios
Probably the most important factor in determining what P/E a company trades on is the earnings growth. That's because companies that grow earnings per share quickly will rapidly increase the 'E' in the equation. That means unless the share price increases, the P/E will reduce in a few years. A lower P/E should indicate the stock is cheap relative to others -- and that may attract buyers.
Honda Siel Power Products shrunk earnings per share by 5.1% last year. But EPS is up 20% over the last 5 years.
Don't Forget: The P/E Does Not Account For Debt or Bank Deposits
The 'Price' in P/E reflects the market capitalization of the company. That means it doesn't take debt or cash into account. In theory, a company can lower its future P/E ratio by using cash or debt to invest in growth.
Such expenditure might be good or bad, in the long term, but the point here is that the balance sheet is not reflected by this ratio.
Honda Siel Power Products's Balance Sheet
Honda Siel Power Products has net cash of ₹605m. That should lead to a higher P/E than if it did have debt, because its strong balance sheets gives it more options.
The Bottom Line On Honda Siel Power Products's P/E Ratio
Honda Siel Power Products trades on a P/E ratio of 17.9, which is above its market average of 13.9. Falling earnings per share is probably keeping traditional value investors away, but the relatively strong balance sheet will allow the company time to invest in growth. Clearly, the high P/E indicates shareholders think it will!
When the market is wrong about a stock, it gives savvy investors an opportunity. If the reality for a company is better than it expects, you can make money by buying and holding for the long term. So this free visual report on analyst forecasts could hold the key to an excellent investment decision.
But note: Honda Siel Power Products may not be the best stock to buy. So take a peek at this free list of interesting companies with strong recent earnings growth (and a P/E ratio below 20).
We aim to bring you long-term focused research analysis driven by fundamental data. Note that our analysis may not factor in the latest price-sensitive company announcements or qualitative material.
If you spot an error that warrants correction, please contact the editor at editorial-team@simplywallst.com. This article by Simply Wall St is general in nature. It does not constitute a recommendation to buy or sell any stock, and does not take account of your objectives, or your financial situation. Simply Wall St has no position in the stocks mentioned. Thank you for reading.
