Should You Be Tempted To Sell Kin Pang Holdings Limited (HKG:1722) Because Of Its P/E Ratio?

This article is for investors who would like to improve their understanding of price to earnings ratios (P/E ratios). To keep it practical, we'll show how Kin Pang Holdings Limited's (HKG:1722) P/E ratio could help you assess the value on offer. What is Kin Pang Holdings's P/E ratio? Well, based on the last twelve months it is 27.13. That means that at current prices, buyers pay HK$27.13 for every HK$1 in trailing yearly profits.
Check out our latest analysis for Kin Pang Holdings
How Do I Calculate A Price To Earnings Ratio?
The formula for P/E is:
Price to Earnings Ratio = Price per Share (in the reporting currency) ÷ Earnings per Share (EPS)
Or for Kin Pang Holdings:
P/E of 27.13 = HK$0.20 (Note: this is the share price in the reporting currency, namely, MOP ) ÷ HK$0.01 (Based on the year to June 2019.)
Is A High Price-to-Earnings Ratio Good?
A higher P/E ratio means that buyers have to pay a higher price for each HK$1 the company has earned over the last year. That is not a good or a bad thing per se, but a high P/E does imply buyers are optimistic about the future.
Does Kin Pang Holdings Have A Relatively High Or Low P/E For Its Industry?
We can get an indication of market expectations by looking at the P/E ratio. The image below shows that Kin Pang Holdings has a higher P/E than the average (10.4) P/E for companies in the construction industry.
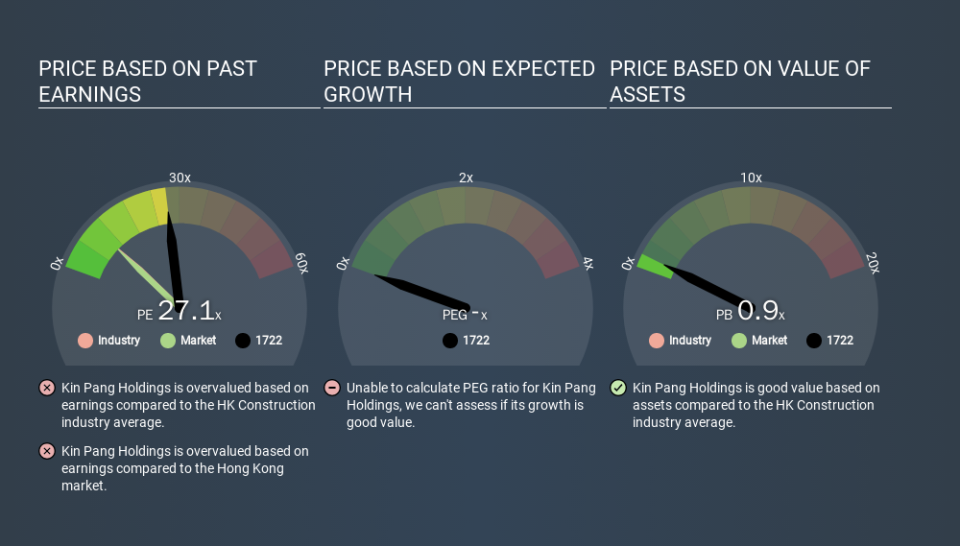
Its relatively high P/E ratio indicates that Kin Pang Holdings shareholders think it will perform better than other companies in its industry classification. Clearly the market expects growth, but it isn't guaranteed. So investors should delve deeper. I like to check if company insiders have been buying or selling.
How Growth Rates Impact P/E Ratios
Probably the most important factor in determining what P/E a company trades on is the earnings growth. That's because companies that grow earnings per share quickly will rapidly increase the 'E' in the equation. And in that case, the P/E ratio itself will drop rather quickly. Then, a lower P/E should attract more buyers, pushing the share price up.
Kin Pang Holdings's earnings per share fell by 5.0% in the last twelve months.
Don't Forget: The P/E Does Not Account For Debt or Bank Deposits
The 'Price' in P/E reflects the market capitalization of the company. Thus, the metric does not reflect cash or debt held by the company. Hypothetically, a company could reduce its future P/E ratio by spending its cash (or taking on debt) to achieve higher earnings.
Such expenditure might be good or bad, in the long term, but the point here is that the balance sheet is not reflected by this ratio.
Kin Pang Holdings's Balance Sheet
Kin Pang Holdings has net cash of MO$47m. This is fairly high at 23% of its market capitalization. That might mean balance sheet strength is important to the business, but should also help push the P/E a bit higher than it would otherwise be.
The Bottom Line On Kin Pang Holdings's P/E Ratio
Kin Pang Holdings trades on a P/E ratio of 27.1, which is above its market average of 10.1. The recent drop in earnings per share would make some investors cautious, but the relatively strong balance sheet will allow the company time to invest in growth. Clearly, the high P/E indicates shareholders think it will!
Investors should be looking to buy stocks that the market is wrong about. As value investor Benjamin Graham famously said, 'In the short run, the market is a voting machine but in the long run, it is a weighing machine. We don't have analyst forecasts, but you might want to assess this data-rich visualization of earnings, revenue and cash flow.
Of course, you might find a fantastic investment by looking at a few good candidates. So take a peek at this free list of companies with modest (or no) debt, trading on a P/E below 20.
If you spot an error that warrants correction, please contact the editor at editorial-team@simplywallst.com. This article by Simply Wall St is general in nature. It does not constitute a recommendation to buy or sell any stock, and does not take account of your objectives, or your financial situation. Simply Wall St has no position in the stocks mentioned.
We aim to bring you long-term focused research analysis driven by fundamental data. Note that our analysis may not factor in the latest price-sensitive company announcements or qualitative material. Thank you for reading.

