Should You Be Tempted To Sell Kuban Power and Electrification Public Joint Stock Company (MCX:KUBE) Because Of Its P/E Ratio?

The goal of this article is to teach you how to use price to earnings ratios (P/E ratios). To keep it practical, we'll show how Kuban Power and Electrification Public Joint Stock Company's (MCX:KUBE) P/E ratio could help you assess the value on offer. Based on the last twelve months, Kuban Power and Electrification's P/E ratio is 24.61. That means that at current prices, buyers pay RUB24.61 for every RUB1 in trailing yearly profits.
Want to participate in a short research study? Help shape the future of investing tools and you could win a $250 gift card!
See our latest analysis for Kuban Power and Electrification
How Do You Calculate Kuban Power and Electrification's P/E Ratio?
The formula for price to earnings is:
Price to Earnings Ratio = Price per Share ÷ Earnings per Share (EPS)
Or for Kuban Power and Electrification:
P/E of 24.61 = RUB64.8 ÷ RUB2.63 (Based on the year to December 2018.)
Is A High Price-to-Earnings Ratio Good?
A higher P/E ratio means that buyers have to pay a higher price for each RUB1 the company has earned over the last year. That isn't necessarily good or bad, but a high P/E implies relatively high expectations of what a company can achieve in the future.
How Growth Rates Impact P/E Ratios
When earnings fall, the 'E' decreases, over time. That means unless the share price falls, the P/E will increase in a few years. Then, a higher P/E might scare off shareholders, pushing the share price down.
Kuban Power and Electrification increased earnings per share by an impressive 11% over the last twelve months. In contrast, EPS has decreased by 31%, annually, over 3 years.
Does Kuban Power and Electrification Have A Relatively High Or Low P/E For Its Industry?
One good way to get a quick read on what market participants expect of a company is to look at its P/E ratio. You can see in the image below that the average P/E (7.2) for companies in the electric utilities industry is a lot lower than Kuban Power and Electrification's P/E.
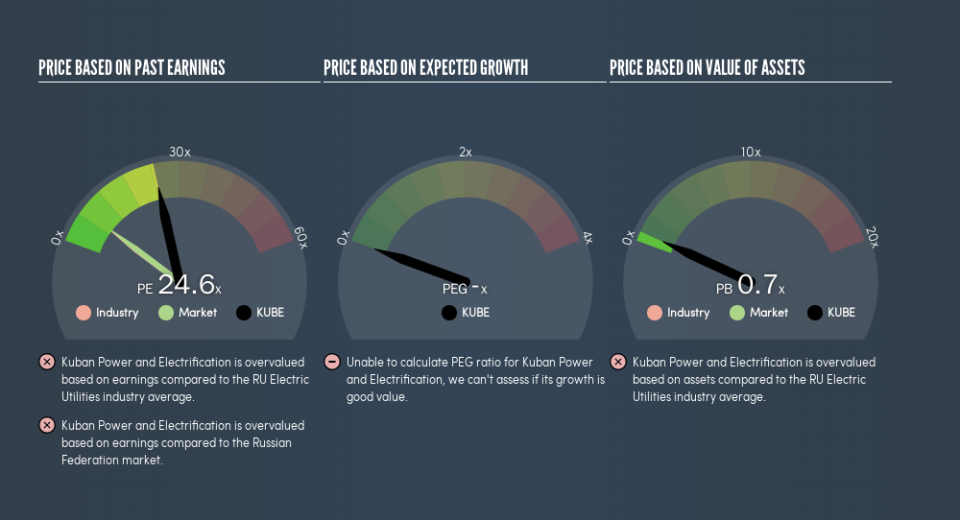
Kuban Power and Electrification's P/E tells us that market participants think the company will perform better than its industry peers, going forward. Clearly the market expects growth, but it isn't guaranteed. So further research is always essential. I often monitor director buying and selling.
Remember: P/E Ratios Don't Consider The Balance Sheet
One drawback of using a P/E ratio is that it considers market capitalization, but not the balance sheet. So it won't reflect the advantage of cash, or disadvantage of debt. Hypothetically, a company could reduce its future P/E ratio by spending its cash (or taking on debt) to achieve higher earnings.
Spending on growth might be good or bad a few years later, but the point is that the P/E ratio does not account for the option (or lack thereof).
So What Does Kuban Power and Electrification's Balance Sheet Tell Us?
Kuban Power and Electrification's net debt is considerable, at 114% of its market cap. If you want to compare its P/E ratio to other companies, you must keep in mind that these debt levels would usually warrant a relatively low P/E.
The Verdict On Kuban Power and Electrification's P/E Ratio
Kuban Power and Electrification's P/E is 24.6 which is way above average (7.4) in the RU market. While the meaningful level of debt does limit its options, it has achieved solid growth over the last year. The relatively high P/E ratio suggests shareholders think growth will continue.
When the market is wrong about a stock, it gives savvy investors an opportunity. If the reality for a company is better than it expects, you can make money by buying and holding for the long term. So this free visual report on analyst forecasts could hold the key to an excellent investment decision.
You might be able to find a better buy than Kuban Power and Electrification. If you want a selection of possible winners, check out this free list of interesting companies that trade on a P/E below 20 (but have proven they can grow earnings).
We aim to bring you long-term focused research analysis driven by fundamental data. Note that our analysis may not factor in the latest price-sensitive company announcements or qualitative material.
If you spot an error that warrants correction, please contact the editor at editorial-team@simplywallst.com. This article by Simply Wall St is general in nature. It does not constitute a recommendation to buy or sell any stock, and does not take account of your objectives, or your financial situation. Simply Wall St has no position in the stocks mentioned. Thank you for reading.

