Should You Be Tempted To Sell OZ Minerals Limited (ASX:OZL) Because Of Its P/E Ratio?

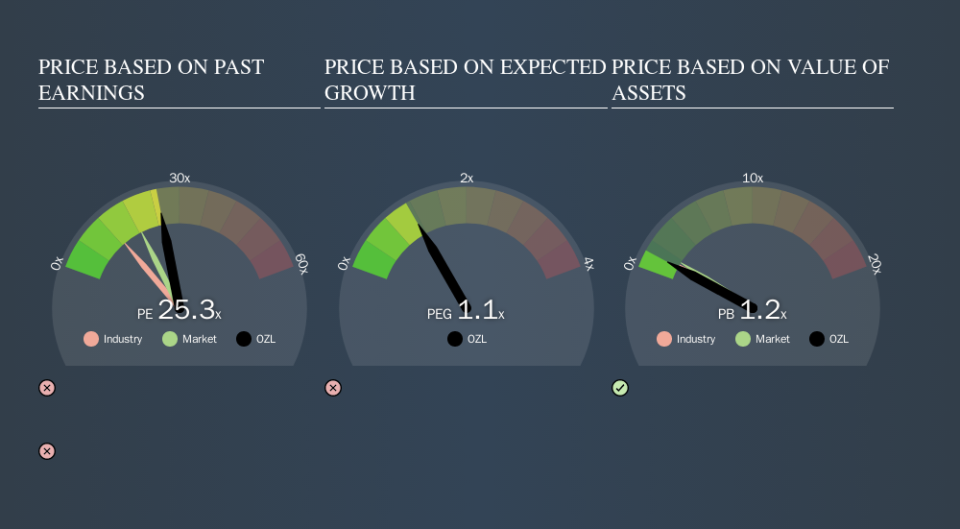
This article is written for those who want to get better at using price to earnings ratios (P/E ratios). To keep it practical, we'll show how OZ Minerals Limited's (ASX:OZL) P/E ratio could help you assess the value on offer. Based on the last twelve months, OZ Minerals's P/E ratio is 25.30. That means that at current prices, buyers pay A$25.30 for every A$1 in trailing yearly profits.
Check out our latest analysis for OZ Minerals
How Do You Calculate A P/E Ratio?
The formula for P/E is:
Price to Earnings Ratio = Price per Share ÷ Earnings per Share (EPS)
Or for OZ Minerals:
P/E of 25.30 = A$10.85 ÷ A$0.43 (Based on the year to June 2019.)
Is A High Price-to-Earnings Ratio Good?
A higher P/E ratio means that investors are paying a higher price for each A$1 of company earnings. That isn't necessarily good or bad, but a high P/E implies relatively high expectations of what a company can achieve in the future.
How Does OZ Minerals's P/E Ratio Compare To Its Peers?
The P/E ratio essentially measures market expectations of a company. You can see in the image below that the average P/E (12.8) for companies in the metals and mining industry is lower than OZ Minerals's P/E.
That means that the market expects OZ Minerals will outperform other companies in its industry. Clearly the market expects growth, but it isn't guaranteed. So further research is always essential. I often monitor director buying and selling.
How Growth Rates Impact P/E Ratios
P/E ratios primarily reflect market expectations around earnings growth rates. That's because companies that grow earnings per share quickly will rapidly increase the 'E' in the equation. And in that case, the P/E ratio itself will drop rather quickly. And as that P/E ratio drops, the company will look cheap, unless its share price increases.
OZ Minerals saw earnings per share decrease by 54% last year. But it has grown its earnings per share by 6.4% per year over the last three years.
Remember: P/E Ratios Don't Consider The Balance Sheet
It's important to note that the P/E ratio considers the market capitalization, not the enterprise value. Thus, the metric does not reflect cash or debt held by the company. Hypothetically, a company could reduce its future P/E ratio by spending its cash (or taking on debt) to achieve higher earnings.
Such spending might be good or bad, overall, but the key point here is that you need to look at debt to understand the P/E ratio in context.
Is Debt Impacting OZ Minerals's P/E?
Since OZ Minerals holds net cash of AU$182m, it can spend on growth, justifying a higher P/E ratio than otherwise.
The Verdict On OZ Minerals's P/E Ratio
OZ Minerals has a P/E of 25.3. That's higher than the average in its market, which is 18.6. Falling earnings per share is probably keeping traditional value investors away, but the healthy balance sheet means the company retains potential for future growth. If fails to eventuate, the current high P/E could prove to be temporary, as the share price falls.
Investors should be looking to buy stocks that the market is wrong about. If the reality for a company is better than it expects, you can make money by buying and holding for the long term. So this free visual report on analyst forecasts could hold the key to an excellent investment decision.
You might be able to find a better buy than OZ Minerals. If you want a selection of possible winners, check out this free list of interesting companies that trade on a P/E below 20 (but have proven they can grow earnings).
We aim to bring you long-term focused research analysis driven by fundamental data. Note that our analysis may not factor in the latest price-sensitive company announcements or qualitative material.
If you spot an error that warrants correction, please contact the editor at editorial-team@simplywallst.com. This article by Simply Wall St is general in nature. It does not constitute a recommendation to buy or sell any stock, and does not take account of your objectives, or your financial situation. Simply Wall St has no position in the stocks mentioned. Thank you for reading.

