Should You Be Tempted To Sell XPO Logistics Europe SA (EPA:XPO) Because Of Its P/E Ratio?

This article is written for those who want to get better at using price to earnings ratios (P/E ratios). We'll apply a basic P/E ratio analysis to XPO Logistics Europe SA's (EPA:XPO), to help you decide if the stock is worth further research. Looking at earnings over the last twelve months, XPO Logistics Europe has a P/E ratio of 27.29. That is equivalent to an earnings yield of about 3.7%.
Check out our latest analysis for XPO Logistics Europe
How Do I Calculate A Price To Earnings Ratio?
The formula for P/E is:
Price to Earnings Ratio = Price per Share ÷ Earnings per Share (EPS)
Or for XPO Logistics Europe:
P/E of 27.29 = EUR260.00 ÷ EUR9.53 (Based on the year to June 2019.)
Is A High P/E Ratio Good?
A higher P/E ratio means that investors are paying a higher price for each EUR1 of company earnings. That is not a good or a bad thing per se, but a high P/E does imply buyers are optimistic about the future.
How Does XPO Logistics Europe's P/E Ratio Compare To Its Peers?
The P/E ratio indicates whether the market has higher or lower expectations of a company. You can see in the image below that the average P/E (15.8) for companies in the logistics industry is lower than XPO Logistics Europe's P/E.
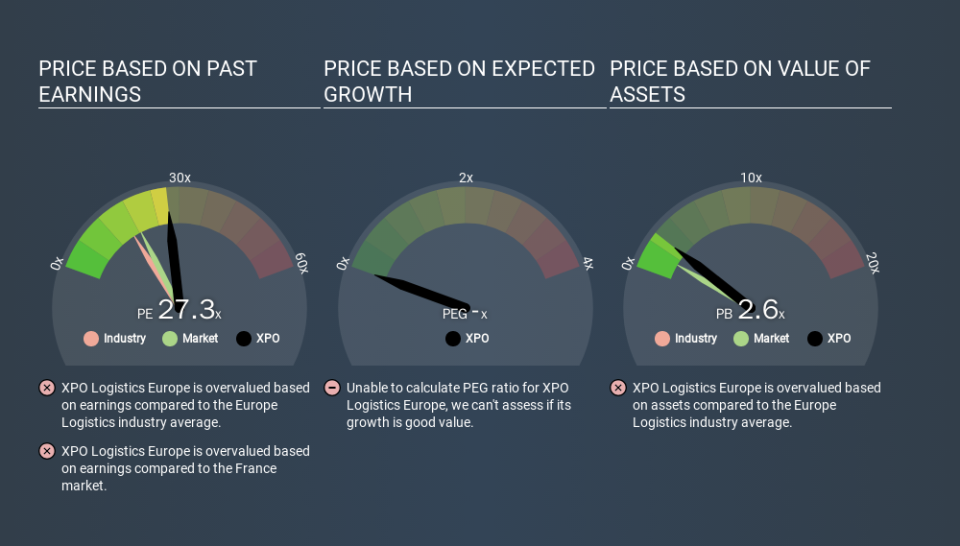
Its relatively high P/E ratio indicates that XPO Logistics Europe shareholders think it will perform better than other companies in its industry classification. The market is optimistic about the future, but that doesn't guarantee future growth. So investors should delve deeper. I like to check if company insiders have been buying or selling.
How Growth Rates Impact P/E Ratios
Probably the most important factor in determining what P/E a company trades on is the earnings growth. Earnings growth means that in the future the 'E' will be higher. That means even if the current P/E is high, it will reduce over time if the share price stays flat. Then, a lower P/E should attract more buyers, pushing the share price up.
XPO Logistics Europe shrunk earnings per share by 30% over the last year. But over the longer term (5 years) earnings per share have increased by 6.2%.
A Limitation: P/E Ratios Ignore Debt and Cash In The Bank
The 'Price' in P/E reflects the market capitalization of the company. That means it doesn't take debt or cash into account. Hypothetically, a company could reduce its future P/E ratio by spending its cash (or taking on debt) to achieve higher earnings.
While growth expenditure doesn't always pay off, the point is that it is a good option to have; but one that the P/E ratio ignores.
So What Does XPO Logistics Europe's Balance Sheet Tell Us?
XPO Logistics Europe has net debt worth 24% of its market capitalization. It would probably deserve a higher P/E ratio if it was net cash, since it would have more options for growth.
The Bottom Line On XPO Logistics Europe's P/E Ratio
XPO Logistics Europe trades on a P/E ratio of 27.3, which is above its market average of 18.5. With modest debt but no EPS growth in the last year, it's fair to say the P/E implies some optimism about future earnings, from the market.
Investors have an opportunity when market expectations about a stock are wrong. If the reality for a company is better than it expects, you can make money by buying and holding for the long term. We don't have analyst forecasts, but you could get a better understanding of its growth by checking out this more detailed historical graph of earnings, revenue and cash flow.
Of course you might be able to find a better stock than XPO Logistics Europe. So you may wish to see this free collection of other companies that have grown earnings strongly.
If you spot an error that warrants correction, please contact the editor at editorial-team@simplywallst.com. This article by Simply Wall St is general in nature. It does not constitute a recommendation to buy or sell any stock, and does not take account of your objectives, or your financial situation. Simply Wall St has no position in the stocks mentioned.
We aim to bring you long-term focused research analysis driven by fundamental data. Note that our analysis may not factor in the latest price-sensitive company announcements or qualitative material. Thank you for reading.
