Tennessee license plate picks: About half of Knox County drivers pick In God We Trust
When given a choice, a little less than half of Knox County drivers have opted for the new "In God We Trust" license plates.
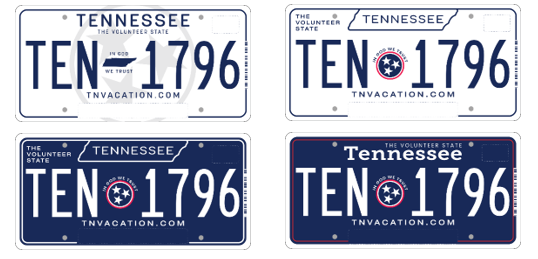
That's on the low end, when looking across Tennessee. Counties have wildly different preferences between the new standard blue and white plates and the ones that feature the national motto, "In God We Trust."
Counties around Knoxville have similar preferences, unlike more rural counties that tip the scales at 70, 80 or even 90% or more of drivers opting to display "In God We Trust."
Among Tennessee's 95 counties, Davidson County has the lowest percentage of vehicle owners choosing to have In God We Trust on the state's new license plates, state data shows. Only 13.3% of Nashvillians getting new plates have opted for the trusting God plates, the numbers show, making Music City a real outlier in the Volunteer State.
A majority of drivers in 86 of the state's 95 counties are choosing the "In God We Trust" plates as of mid-May, according to numbers from the state Department of Revenue.
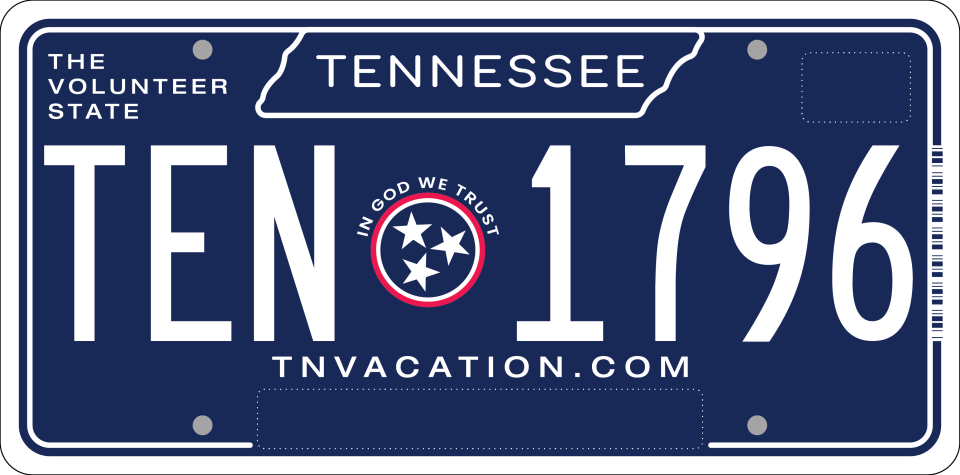
It's not your imagination: Why are the numbers and letters reversed on Tennessee's In God We Trust license plates?
But before you decide that Nashville is full of godless heathen drivers, there are non-religious reasons why Davidson County's number might be so low.
Many Nashville drivers said they didn't know they could choose between two plates.
"I went in person and wasn't given a choice," radio personality Terry "Holly Wood" Hendrix said. "They handed me what they handed me."
And what you're handed in Davidson County — if you don't say anything about a preference — is the plate without "In God We Trust" on it, county clerk's office officials said.

The county with the highest percentage of drivers choosing the God plates is Fentress, a rural county that sits near the Kentucky line between Nashville and Knoxville.
There, 98% have chosen the "In God We Trust" plates so far, with motorists saying so out loud as soon as they walked up to the counter in Jamestown, Tennessee, deputy clerk Anna Rains said.
Why so high in Fentress County?
"Bible belt," Rains said.
Act now: Real ID deadline is coming in a year, and you can't fly without it. Here's what to know
The counties bordering Nashville also fall in the bottom half of all Tennessee counties in percentage of drivers choosing "In God We Trust" on their new plates.
Here's a list of the counties and county seats, from highest to lowest percentage of drivers choosing "In God We Trust" plates.
1. Fentress County, Jamestown, Tenn., 98.1%
2. Benton County, Camden, Tenn., 97.9%
3. Van Buren, Spencer, Tenn., 97.7%
4. Overton County, Livingston, Tenn., 97.4%
5. Dekalb County, Smithville, Tenn., 94.1%
6. Polk County, Benton, Tenn., 94.1%
7. Hancock County, Sneedville, Tenn., 90.3%
8. Lawrence County,Lawrenceburg, Tenn., 90.1%
9. Moore County, Lynchburg, Tenn., 89.9%
10. Haywood County, Brownsville, Tenn., 88.9%
11. Wayne County, Waynesboro, Tenn., 88.7%
12. Chester County, Henderson, Tenn., 88.6%
13. Johnson County, Mountain City, Tenn., 88.4%
14. Franklin County, Winchester, Tenn., 88.6%
15. Decatur County, Decaturville, Tenn., 88%
16. Macon County, Lafayette, Tenn., 87.5%
17. Weakley County, Dresden, Tenn., 86.2%
18. Dyer County, Dyersburg, Tenn., 86.1%
19. Obion County, Union City, Tenn., 86%
20. McNairy County, Selmer, Tenn., 85.9%
21. Grainger County, Rutledge, Tenn., 85.8%
22. Hardin County, Savannah, Tenn., 85.8%
23. Hickman County, Centerville, Tenn., 85.7%
24. Scott County, Huntsville, Tenn., 82.8%
25. Claiborne County, Tazewell, Tenn., 82.6%
26. Henry County, Paris, Tenn., 82.4%
27. Bledsoe County, Pikeville, Tenn., 82.3%
28. Lake County, Tiptonville, Tenn., 82%
29. Campbell County, Jacksboro, Tenn., 81.8%
30. Smith County, Carthage, Tenn., 81.4%
31. Lincoln County, Fayetteville, Tenn., 81.1%
32. Clay County, Celina, Tenn., 80.9%
33. Gibson County, Trenton, Tenn., 80.3%
34. Hardeman County, Bolivar, Tenn., 80%
35. Carroll County, Huntingdon, Tenn., 79.7%
36. Cocke County, Newport, Tenn., 79.4%
37. Trousdale County, Hartsville, Tenn., 79.4%
38. Meigs County, Decatur, Tenn., 78.6%
39. Crockett County, Alamo, Tenn., 78.5%
40. Houston County, Erin, Tenn., 78.2%
41. Lewis County, Hohenwald, Tenn., 77.8%
42. Carter County, Elizabethton, Tenn., 77.4%
43. Jefferson County, Dandridge, Tenn., 77.3%
44. Roane County, Kingston, Tenn., 77.2%
45. Cannon County, Woodbury, Tenn., 76.8%
46. Marshall County, Lewisburg, Tenn., 76.6%
47. Lauderdale County, Ripley, Tenn., 75.8%
48. Robertson County, Springfield, Tenn., 75.6%
49. Union County, Maynardville, Tenn., 75.5%
50. Rhea County, Dayton, Tenn., 75.2%
51. Fayette County, Somerville, Tenn., 74.9%
52. Stewart County, Dover, Tenn., 74.6%
53. Humphreys County, Waverly, Tenn., 74.5%
54. Pickett County, Byrdstown, Tenn., 74.2%
55. Henderson County, Lexin73.8%
56. Greene County, Greeneville, Tenn., 73.7%
57. Bedford County, Shelbyville, Tenn., 73.3%
58. Sequatchie County, Dunlap, Tenn., 72.9%
59. Coffee County, Manchester, Tenn., 72.3%
60. Unicoi County, Erwin, Tenn., 72.3%
61. Grundy County, Altamont, Tenn., 71.6%
62. Marion County, Jasper, Tenn., 71.6%
63. Cheatham County, Ashland City, Tenn., 70.2%
64. Dickson County, Charlotte, Tenn., 70.2%
65. Hawkins County, Rogersville, Tenn., 69.9%
66. White County, Sparta, Tenn., 69.2%
67. Sevier County, Sevierville, Tenn., 68.3%
68. Perry County, Linden, Tenn., 67.9%
69. Hamblen County, Morristown, Tenn., 67.5%
70. Loudon County, Loudon, Tenn., 67.4%
71. Cumberland County, Crossville, Tenn., 67.3%
72. Warren County, McMinnville, Tenn., 67.1%
73. Maury County, Columbia, Tenn., 66.7%
74. McMinn County, Athens, Tenn., 66.7%
75. Putnam County, Cookeville, Tenn., 66.4%
76. Montgomery County, Clarksville, Tenn., 65.6%
77. Tipton County, Covington, Tenn., 64.6%
78. Giles County, Pulaski, Tenn., 64.2%
79. Sumner County, Gallatin, Tenn., 63.9%
80. Bradley County, Cleveland, Tenn., 62.5%
81. Sullivan County, Blountville, Tenn., 61.8%
82. Hamilton County, Chattanooga, Tenn., 57.6%
83. Monroe County, Madisonville, Tenn., 56.6%
84. Blount County, Maryville, Tenn., 54.5%
85. Morgan County, Wartburg, Tenn., 52.6%
86. Wilson County, Lebanon, Tenn., 52.2%
87. Rutherford County, Murfreesboro, Tenn., 49.9%
88. Knox County, Knoxville, Tenn., 48%
89. Jackson County, Gainesboro, Tenn., 47.5%
90. Anderson County, Clinton, Tenn., 46.6%
91. Washington County, Jonesborough, Tenn., 39.2%
92. Williamson County, Franklin, Tenn., 39.1%
93. Madison County, Jackson, Tenn., 35.9%
94. Shelby County, Memphis, Tenn., 27.2%
95. Davidson County, Nashville, Tenn., 13.3%
This article originally appeared on Nashville Tennessean: Tennessee license plate: Half of Knox County drivers pick In God We Trust

