Teranga Gold Update to Wahgnion Gold Operation Mine Plan Increases Average Annual Production by 25%
Figure 1
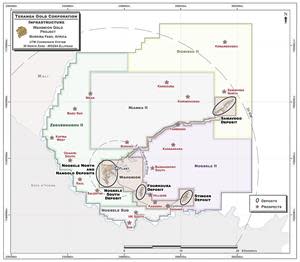
Map of Wahgnion Gold Project
Revised production schedule reflects higher plant throughput capability; raising 2020 guidance
(All amounts are in U.S. dollars unless otherwise stated)
TORONTO, Aug. 06, 2020 (GLOBE NEWSWIRE) -- Teranga Gold Corporation (“Teranga” or the “Company”) (TSX: TGZ) (OTCQX: TGCDF) is pleased to report an updated life of mine (“LOM”) plan and new 2020 guidance for its Wahgnion Gold Operation (“Wahgnion”), located in southwest Burkina Faso, West Africa.
Since achieving commercial production on November 1, 2019, Wahgnion’s processing plant has performed approximately 25% above nameplate capacity for throughput and gold recovery, resulting in higher than planned production. As such, Teranga has updated the LOM plan to accommodate the higher plant throughput capability, increasing Wahgnion’s average annual production by 25% and reducing the mine life to 10 years. With a goal of extending the mine life to 15 years, Teranga has commenced a multi-year drilling and exploration campaign around three of the existing deposit areas and at more than a dozen promising targets at Wahgnion.
Teranga has also increased Wahgnion’s 2020 guidance for gold production to between 150,000 and 165,000 ounces, up from earlier guidance of 130,000 to 140,000 ounces. The higher guidance for 2020 is based on mill throughput of between 3.0Mtpa and 3.2Mtpa and total material movement of between 22Mtpa and 26Mtpa.
“The updated life of mine plan is very good news for Wahgnion, and for Teranga overall,” said Richard Young, President and CEO. “With production averaging about 150,000 ounces of gold per year through 2025 at reasonable costs and at current gold prices, we expect to generate significantly more net cash flow from Wahgnion in the coming years, compared to the original feasibility study.”
Mr. Young added: “The Wahgnion update further demonstrates our team’s exploration, development and operating expertise, which we will leverage at the newly integrated Sabodala-Massawa complex and across our pipeline of early to advanced stage exploration properties in West Africa.”
Updated Wahgnion LOM Highlights
Annual 5-year Average | Annual Life of Mine Average | |||
Gold production | 149,000 oz | 138,000 oz | ||
Mill grade | 1.67 g/t | 1.59 g/t | ||
Plant throughput | 3.0Mtpa | 2.9Mtpa | ||
All-in sustaining costs (AISC) per ounce (1)(2) | $920 | $1,007 | ||
Net cash flow (2)* | $83M | $64M | ||
* Net cash flow after minority interest
Year-to-date, total gold recovered in the plant is reconciling well to reserve models following a minor negative reconciliation to reserves in 2019 due to the impact of historic artisanal activities and start-up conditions during plant commissioning. As of December 31, 2019, Wahgnion had a proven and probable reserve base of 1.55 million ounces (30.32 Mt at 1.59 g/t Au at $1,250 gold) and measured and indicated resources of 2.37 million ounces (49.62 Mt at 1.49 g/t Au at $1,500 gold).
“We are extremely pleased with the results of the Wahgnion life of mine plan update, with the confirmation of sustainable higher plant throughput rates and the corresponding increase in production,” said Paul Chawrun, Chief Operating Officer. “We are also confident in Wahgnion’s potential to increase resources and ultimately reserves in the coming years. Our reserve development drill program will focus on Nogbele, Fourkoura and Stinger, which are all near-mill deposits that demonstrate room for expansion, as well as at over a dozen regional prospects that have undergone limited drilling and present further upside.”
Wahgnion’s priority exploration prospects demonstrate favourable lithology and structural characteristics with positive geochemical and geophysical signatures similar to the known deposits comprising the current reserve base.
Project Return Sensitivity Analysis (2)
(In US$ Millions)
Gold Price | $/oz | $1,500/oz | $1,600/oz | $1,700/oz | $1,800/oz | ||||
After-tax NPV0% | $ millions | $583 | $695 | $808 | $920 | ||||
After-tax NPV5% | $ millions | $476 | $566 | $656 | $746 | ||||
After-tax after minority interest NPV0% | $ millions | $561 | $662 | $762 | $863 | ||||
After-tax after minority interest NPV5% | $ millions | $461 | $543 | $625 | $707 | ||||
Updated Wahgnion LOM Mine Plan
The mine plan for Wahgnion focuses on open-pit mining of four initial gold deposits within the mine lease, which includes the Nogbele, Fourkoura, Stinger and Samavogo deposits (see Figure 1 in Appendix).
The Wahgnion processing plant is adjacent to the Nogbele deposit, which contains approximately 50% of total mineral reserves. The Fourkoura, Stinger, and Samavogo deposits are each located within 25 kilometres of the plant.
Mining Plan | Unit | Total | 2020 | 2021 | 2022 | 2023 | 2024 | 2025 | 2026 | 2027 | 2028 | 2029 | 2030 |
Total Ore | Mt | 29.7 | 2.8 | 2.9 | 2.9 | 3.1 | 3.1 | 2.9 | 3.0 | 2.6 | 2.7 | 2.8 | 1.0 |
Total Ore Grade | g/t | 1.60 | 1.74 | 1.86 | 1.35 | 1.76 | 1.76 | 1.66 | 1.32 | 1.45 | 1.49 | 1.50 | 1.89 |
Total Waste | Mt | 247.7 | 19.4 | 17.4 | 17.2 | 24.0 | 28.6 | 28.1 | 29.2 | 26.4 | 29.6 | 24.1 | 3.7 |
Total Movement | Mt | 277.4 | 22.2 | 20.3 | 20.1 | 27.1 | 31.7 | 31.0 | 32.2 | 29.0 | 32.4 | 26.8 | 4.7 |
Total Tonnes: Oxide | % | 43 | 68 | 47 | 36 | 64 | 60 | 32 | 41 | 30 | 42 | 20 | 0 |
Total Tonnes: Transition | % | 13 | 14 | 22 | 12 | 13 | 11 | 11 | 25 | 12 | 12 | 3 | 0 |
Total Tonnes: Fresh | % | 44 | 18 | 31 | 52 | 23 | 29 | 56 | 34 | 58 | 46 | 77 | 100 |
Nogbele Movement | Mt | 131.4 | 22.2 | 12.0 | 5.2 | 11.4 | 10.2 | 10.7 | 25.6 | 17.7 | 7.8 | 8.6 | |
Fourkoura Movement | Mt | 21.3 | 8.2 | 13.0 | |||||||||
Samavogo Movement | Mt | 62.6 | 1.9 | 15.7 | 9.6 | 11.4 | 6.6 | 11.3 | 6.1 | ||||
Stinger Movement | Mt | 62.2 | 11.9 | 8.9 | 18.4 | 18.3 | 4.7 | ||||||
Processing Plan | Unit | Total | 2020 | 2021 | 2022 | 2023 | 2024 | 2025 | 2026 | 2027 | 2028 | 2029 | 2030 |
Total Ore | Mt | 30.3 | 3.0 | 3.0 | 2.9 | 3.0 | 3.1 | 2.9 | 3.0 | 2.8 | 2.9 | 2.8 | 1.0 |
Total Grade | g/t | 1.59 | 1.73 | 1.84 | 1.35 | 1.76 | 1.75 | 1.66 | 1.32 | 1.39 | 1.43 | 1.50 | 1.89 |
Ounces Processed | Moz | 1.5 | 0.17 | 0.18 | 0.12 | 0.17 | 0.18 | 0.15 | 0.13 | 0.13 | 0.13 | 0.13 | 0.06 |
Ounces Recovered | Moz | 1.4 | 0.15 | 0.16 | 0.11 | 0.16 | 0.16 | 0.14 | 0.12 | 0.12 | 0.12 | 0.12 | 0.05 |
Oxide | % | 34 | 60 | 33 | 25 | 44 | 50 | 30 | 31 | 20 | 34 | 20 | 0 |
Operating Costs(2)
Operating costs include all direct costs for the production of gold doré. The estimates are based on annual rates determined in the mining schedule with ore delivery from the Wahgnion pits.
Unit mining costs have increased by approximately 20 cents per tonne, compared to the National Instrument 43-101 – Standards of Disclosure for Mineral Projects (“NI 43-101”) amended technical report on Wahgnion dated July 31, 2019 (“the Report”). Cost increases are due to the change in the composition of the mobile equipment fleet to accommodate more challenging than expected ground conditions in the oxide zones of the pits, as well as extending contractors to increase the mining rate to accommodate the higher mill throughput. Unit processing costs are marginally lower than those set out in the Report, while general and administrative costs are higher than those in the Report by $1.30 per tonne milled, largely due to additional security costs. Overall, total gold production and recovery rates are in line with the Report. Total capital, including development and sustaining capital, has increased by approximately $30 million due to additional mobile equipment required to move approximately 25% more material annually.
Unit | LOM Average Cost | |
Open Pit Mining | $/tonne mined | 2.40 |
Processing | $/tonne milled | 11.40 |
General and Admin | $/tonne milled | 5.40 |
General and administrative costs consist of site office costs, insurance, financial costs (banking charges, legal fees, etc.), refining and transportation costs and personnel costs.
Notes for LOM Production Schedule
(1) Based on the mineral reserves estimates as at December 31, 2019.
(2) Proven and probable mineral reserves are based on a $1,250/oz gold price.
(3) Sum of individual amounts may not equal due to rounding.
Endnotes
(1) The Company has included non-IFRS measures in this document, including total cash costs, total cash costs per ounce, AISC, and AISC per ounce. The Company believes that these measures, in addition to conventional measures prepared in accordance with IFRS, provide investors an improved ability to evaluate the underlying performance of the Company. The non-IFRS measures are intended to provide additional information and should not be considered in isolation or as a substitute for measures of performance prepared in accordance with IFRS. These measures do not have any standardized meaning prescribed under IFRS, and therefore may not be comparable to other issuers. Total cash costs figures are calculated in accordance with a standard developed by The Gold Institute, which was a worldwide association of suppliers of gold and gold products and included leading North American gold producers. The Gold Institute ceased operations in 2002, but the standard is considered the accepted standard of reporting cash cost of production in North America. Adoption of the standard is voluntary and the cost measures presented may not be comparable to other similarly titled measure of other companies. Total cash cost per ounce sold is a common financial performance measure in the gold mining industry but has no standard meaning under IFRS. The Company reports total cash costs on a sales basis. We believe that, in addition to conventional measures prepared in accordance with IFRS, certain investors use this information to evaluate the Company’s performance and ability to generate cash flow. Accordingly, it is intended to provide additional information and should not be considered in isolation or as a substitute for measures of performance prepared in accordance with IFRS. The measure, along with sales, is considered to be a key indicator of a Company’s ability to generate operating profits and cash flow from its mining operations.
Beginning in the second quarter 2013, we adopted an AISC measure consistent with the guidance issued by the World Gold Council (“WGC”) on June 27, 2013, of which Teranga became a member on November 27, 2018. The Company believes that the use of AISC is helpful to analysts, investors and other stakeholders of the Company in assessing its operating performance, its ability to generate net cash flow from current operations and its overall value. This measure is helpful to governments and local communities in understanding the economics of gold mining. AISC is an extension of existing “cash cost” metrics and incorporate costs related to sustaining production. The WGC definition of AISC seeks to extend the definition of total cash costs by adding corporate general and administrative costs, reclamation and remediation costs (including accretion and amortization), exploration and study costs (capital and expensed), capitalized stripping costs and sustaining capital expenditures and represents the total costs of producing gold from current operations. AISC excludes income tax payments, interest costs, costs related to business acquisitions and items needed to normalize profits. Consequently, this measure is not representative of all of the Company’s cash expenditures. In addition, the calculation of AISC does not include depreciation expense as it does not reflect the impact of expenditures incurred in prior periods. Therefore, it is not indicative of the Company’s overall profitability. Life of mine total cash costs and AISC used in this press release are before cash/non-cash inventory movements, and exclude any allocation of corporate overheads. Other companies may calculate this measure differently.
For more information regarding these measures, please refer to Teranga’s Management’s Discussion and Analysis for the three months ended March 31, 2020 accessible on the Company’s website at www.terangagold.com.
(2) Life of mine assumptions include:
Gold price: $1,600 per ounce
Heavy fuel oil (HFO): $0.72 per litre
Light fuel oil (LFO): $1.04 per litre
Euro to USD Exchange Rate: 1.10:1
Forward-Looking Statements
This press release contains certain statements that constitute forward-looking information within the meaning of applicable securities laws (“forward-looking statements”), which reflects management's expectations regarding Teranga’s future growth opportunities, results of operations, performance (both operational and financial) and business prospects (including the timing and development of new deposits and the success of exploration activities) and other opportunities. Wherever possible, words such as “plans”, “expects”, “does not expect”, “scheduled”, “trends”, “indications”, “potential”, “estimates”, “predicts”, “anticipate”, “to establish”, “does not anticipate”, "believe”, "intend”, “ability to” and similar expressions or statements that certain actions, events or results “may”, “could”, “would”, “might”, “will”, or are “likely” to be taken, occur or be achieved, have been used to identify such forward looking information. Specific forward-looking statements in this press release include, but are not limited to, statements and information with respect to Wahgnion’s life of mine plan, financial and operational results, ore production and the capital and operating costs in respect thereof, proposed operational changes and the timing thereof, future opportunities for enhancing development at Wahgnion, and timing for the release of the Company’s disclosure. Although the forward-looking information contained in this press release reflect management’s current beliefs based upon information currently available to management and based upon what management believes to be reasonable assumptions, Teranga cannot be certain that actual results will be consistent with such forward-looking information. Such forward-looking statements are based upon assumptions, opinions and analysis made by management in light of its experience, current conditions and its expectations of future developments that management believe to be reasonable and relevant but that may prove to be incorrect. These assumptions include, among other things, the closing and timing of financing, the ability to obtain any requisite governmental approvals, the accuracy of mineral reserve and mineral resource estimates, gold price, exchange rates, fuel and energy costs, future economic conditions, anticipated future estimates of net cash flow, and courses of action. Teranga cautions you not to place undue reliance upon any such forward-looking statements.
About Teranga
Teranga Gold is transitioning into a mid-tier gold producer operating long-life, low-cost mines and advancing prospective exploration properties across West Africa, one of the world’s fastest growing gold jurisdictions. The top-tier gold complex created by integrating the recently acquired high-grade Massawa Project with the Company’s Sabodala mine, the successful commissioning of Wahgnion, Teranga’s second gold mine, and a strong pipeline of early to advanced-stage exploration assets support the continued growth of Teranga’s reserves, production and cash flow. Through its continued success and commitment to responsible mining, Teranga creates sustainable value for all stakeholders and acts as a catalyst for social, economic, and environmental development.
Contact Information
Richard Young | Trish Moran |
Figure 1 – Map of Wahgnion
https://www.globenewswire.com/NewsRoom/AttachmentNg/eb0849dc-ae9e-432c-b24e-20646572c224
Table A – Life of Mine Cash Flow(2)
Unit | LOM 2020+ | 5-Year Average | LOM Average | 2020 | 2021 | 2022 | 2023 | 2024 | 2025 | 2026 | 2027 | 2028 | 2029 | 2030 | 2031 | |
Production | koz | 1,429 | 149 | 138 | 154 | 163 | 115 | 162 | 164 | 141 | 117 | 117 | 124 | 120 | 53 | - |
Gold Price | $/oz | 1,600 | 1,600 | 1,600 | 1,600 | 1,600 | 1,600 | 1,600 | 1,600 | 1,600 | 1,600 | 1,600 | 1,600 | 1,600 | 1,600 | - |
Revenue | USDM | 2,306 | 241 | 223 | 252 | 274 | 183 | 259 | 262 | 226 | 188 | 187 | 199 | 193 | 84 | - |
Total Cash Cost (3) | USDM | 1,297 | 124 | 126 | 122 | 117 | 115 | 121 | 130 | 137 | 128 | 131 | 130 | 125 | 41 | - |
Capex | USDM | 143 | 14 | 14 | 19 | 5 | 17 | 15 | 17 | 15 | 15 | 18 | 11 | 6 | 6 | - |
Regional Admin | USDM | 11 | 1 | 1 | 1 | 1 | 1 | 1 | 1 | 1 | 1 | 1 | 1 | 1 | 1 | - |
All-in Sustaining Costs (AISC) | USDM | 1,451 | 138 | 140 | 143 | 123 | 132 | 137 | 148 | 152 | 144 | 150 | 142 | 132 | 48 | - |
All-in Sustaining Costs (AISC) (3) | $/oz | 1,007 | 920 | 1,007 | 908 | 717 | 1,154 | 846 | 906 | 1,079 | 1,229 | 1,288 | 1,141 | 1,092 | 917 | - |
Development Capex | USDM | 29 | 2 | 3 | 18 | 5 | 3 | 2 | 2 | 0 | - | - | - | - | - | - |
Cash Flow Before Taxes, | USDM | 825 | 100 | 80 | 91 | 146 | 49 | 120 | 112 | 73 | 43 | 36 | 57 | 61 | 36 | - |
Taxes, Mine Closure, and Other (4) | USDM | 130 | 15 | 13 | 13 | 10 | 13 | 7 | 22 | 22 | 15 | 12 | 11 | 14 | (9) | (0) |
Net Cash Flow | USDM | 695 | 85 | 67 | 78 | 137 | 36 | 113 | 90 | 51 | 28 | 24 | 46 | 48 | 45 | 0 |
Minority Interest | USDM | 34 | 2 | 3 | - | - | - | - | 1 | 9 | 5 | 3 | 2 | 5 | 5 | 4 |
Cash Flow After Minority Interest | USDM | 662 | 83 | 64 | 78 | 137 | 36 | 113 | 90 | 42 | 23 | 21 | 44 | 43 | 40 | (4) |
Table B – Life of Mine Operating Costs(2)
Unit | LOM 2020+ | 5-Year | LOM | 2020 | 2021 | 2022 | 2023 | 2024 | 2025 | 2026 | 2027 | 2028 | 2029 | 2030 | |
Open Pit Mining | USD/t mined | 2.4 | 2.3 | 2.4 | 2.5 | 2.5 | 2.7 | 2.1 | 2.1 | 2.4 | 2.1 | 2.4 | 2.1 | 2.6 | 4.1 |
Processing CIL | USD/t milled | 11.4 | 11.2 | 11.4 | 11.6 | 11.2 | 11.7 | 10.9 | 10.6 | 11.4 | 11.2 | 11.8 | 11.1 | 11.9 | 12.6 |
General & Admin. | USD/t milled | 5.4 | 5.4 | 5.4 | 6.2 | 5.4 | 5.6 | 5.3 | 5.2 | 5.6 | 5.4 | 5.7 | 5.5 | 3.7 | 5.3 |
Mining | USDM | 654 | 60 | 63 | 56 | 51 | 54 | 56 | 66 | 74 | 67 | 70 | 70 | 70 | 19 |
Processing CIL | USDM | 346 | 33 | 33 | 35 | 34 | 33 | 33 | 33 | 33 | 34 | 33 | 33 | 33 | 12 |
General & Admin | USDM | 161 | 16 | 16 | 18 | 16 | 16 | 16 | 16 | 16 | 16 | 16 | 16 | 10 | 5 |
Refining & Freight | USDM | 5 | 0 | 0 | 1 | 1 | 0 | 0 | 0 | 0 | 0 | 0 | 0 | 0 | 0 |
By-product Credits | USDM | (3) | (0) | (0) | (0) | (0) | (0) | (0) | (0) | (0) | (0) | (0) | (0) | (0) | (0) |
Total Operating Costs | USDM | 1,162 | 110 | 112 | 109 | 101 | 104 | 106 | 115 | 123 | 117 | 120 | 118 | 113 | 36 |
Capitalized Deferred Stripping (1) | USDM | (2) | - | (0) | (2) | - | - | - | - | - | - | - | - | - | - |
Royalties (2) | USDM | 137 | 14 | 13 | 15 | 16 | 11 | 15 | 16 | 13 | 11 | 11 | 12 | 11 | 5 |
Total Cash Costs(3) | USDM | 1,297 | 124 | 126 | 122 | 117 | 115 | 121 | 130 | 137 | 128 | 131 | 130 | 125 | 41 |
Total Cash Costs(3) | USD/oz | 900 | 824 | 900 | 778 | 685 | 1,000 | 749 | 796 | 968 | 1,089 | 1,122 | 1,047 | 1,036 | 786 |
Sustaining Capex | USDM | 142 | 14 | 14 | 17 | 5 | 17 | 15 | 17 | 15 | 15 | 18 | 11 | 6 | 6 |
Capitalized Deferred Stripping (1) | USDM | 2 | - | 0 | 2 | - | - | - | - | - | - | - | - | - | - |
Regional Admin | USDM | 11 | 1 | 1 | 1 | 1 | 1 | 1 | 1 | 1 | 1 | 1 | 1 | 1 | 1 |
All-In Sustaining Costs (AISC) | USDM | 1,451 | 138 | 140 | 143 | 123 | 132 | 137 | 148 | 152 | 144 | 150 | 142 | 132 | 48 |
AISC | USD/oz | 1,007 | 920 | 1,007 | 908 | 717 | 1,154 | 846 | 906 | 1,079 | 1,229 | 1,288 | 1,141 | 1,092 | 917 |
Development Capex | USDM | 29 | 2 | 3 | 18 | 5 | 3 | 2 | 2 | 0 | - | - | - | - | - |
Notes to Tables A and B above:
(1) Excludes any capitalized deferred stripping adjustments beyond 2020.
(2) Royalties include royalties on total production payable to both the Government of Burkina Faso and a privately held Company.
(3) Total cash costs per ounce and all-in sustaining costs per ounce are non-IFRS financial measures and do not have a standard meaning under IFRS. Total cash costs per ounce and all-in sustaining costs per ounce are before cash/non-cash inventory movements, and excludes allocation of corporate overheads. Please refer to non-IFRS Performance Measures.
(4) Taxes, mine closure and other includes income taxes paid to the Government of Burkina Faso, government social fund, working capital, closure cost payments, and plant residual value. Sustainability costs and exploration costs are not included.
(5) Sum of individual amounts may not equal due to rounding.
